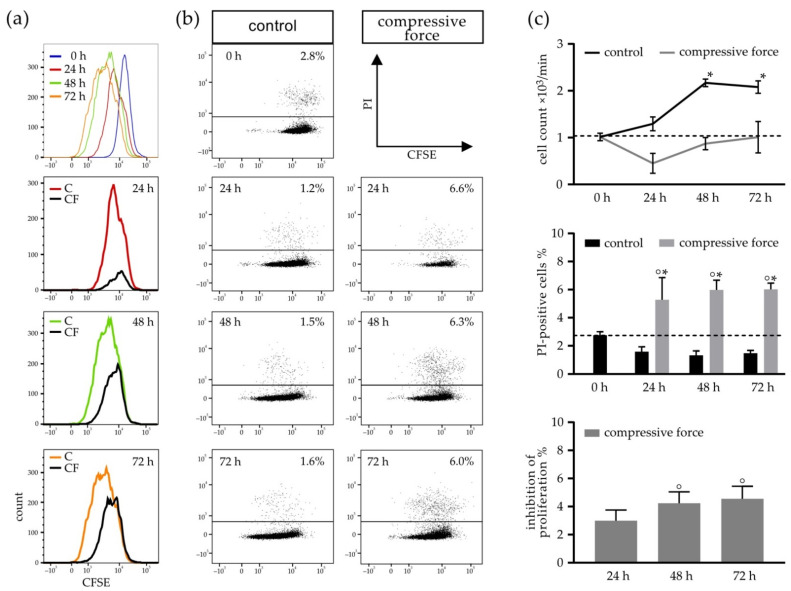
Figure 3.
Disparities in CFSE–PI-stained hPDLFs between the control (C) and compressive force groups (CF) in terms of the cell count, PI-positive cells (dead cells) and inhibition of proliferation measured by flow cytometry. Data shown is representative for the CFSE–fluorescence intensity and inhibition of proliferation in the CF (a) and CFSE-positive and CFSE/PI-positive events (b). (c) Evaluation of the flow cytometry results in terms of the cell count, percentage of PI-positive cells and inhibition of proliferation. Bars indicate the mean values ± standard deviation. A p-value < 0.05 was considered statistically significant. (*) Comparison of the 24-h, 48-h and 72-h (C and CF) time points with the 0-h control. (°) Comparison of the CF with the respective control of the time point.

