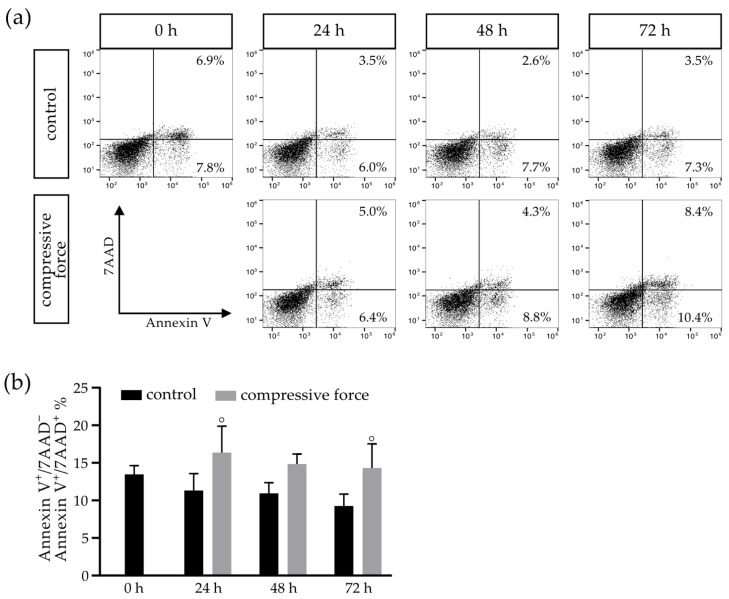
Figure 4.
Flow cytometry examination of hPDLFs after Annexin V/7AAD staining in relation to apoptotic cell death, with an exemplary representation of all events at 0–72 h in the control (C) and compressive force (CF) groups (a). The total percentage of Annexin V+/7AAD− and Annexin V+/7AAD+ events in C showed a dead cell percentage of 15%, which decreased over time, while the proportion in the CF group significantly increased (b). Bars indicate the mean values ± standard deviation. A p-value < 0.05 was considered statistically significant. (°) Comparison of the CF with the respective control of the time point.

