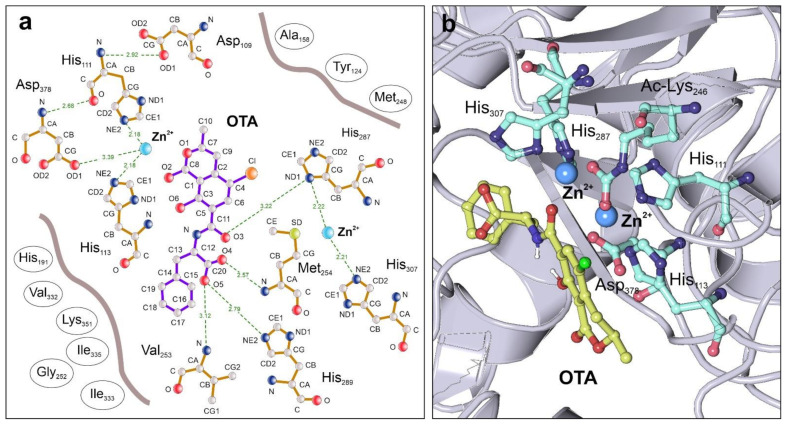
Figure 2.
Catalytic residues and molecular interactions of A. niger ochratoxinase (PDB code: 4C5Y) determined by blind molecular docking. (a) Two-dimensional Ligplot diagram [52] showing the interactions established between the substrate OTA and the residues in the catalytic pocket, as determined by cavity detection and blind docking with the CB-Dock software [35]. Hydrogen bonds are depicted by dotted lines showing the distances between the interacting atoms represented in Angstroms. The amino acids configuring the substrate-binding pocket and establishing other molecular interactions with OTA are represented by circles.; (b) Tridimensional view of the enzyme catalytic pocket in complex with the OTA substrate, showing the presence of the modified residue Acetyl-Lys246 that is essential for the stability of the binuclear Zinc center, and the remaining metal-coordinating amino acids. This representation has been prepared with the Protein Imager software [50].

