Figure 5.
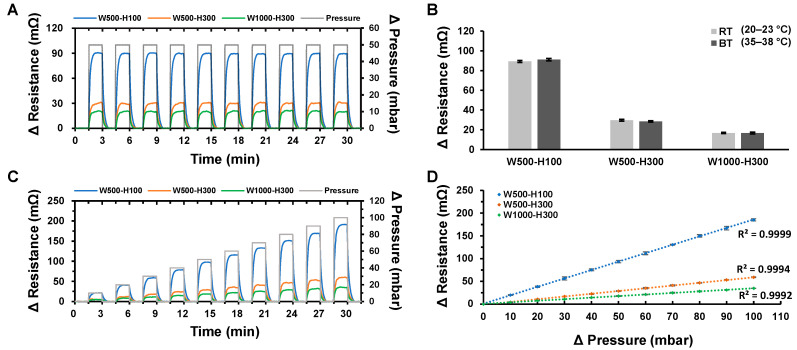
(A) Change of the electrical resistance in accordance to the periodic pressure changes (n = 3). (B) Comparison of the ΔR measurements at two different temperatures (RT = 23–25 °C, BT = 35–38 °C). (C) Change of the electrical resistance in accordance to the incremental pressure changes (n = 3). (D) Graph showing the linearity between the applied pressure and the measured electrical resistance (n = 3).

