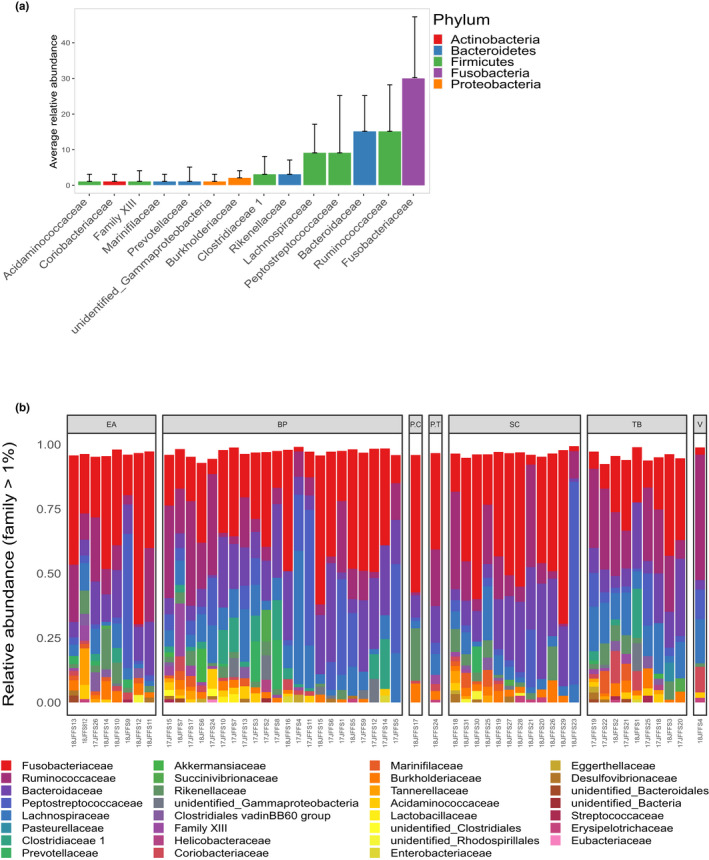
FIGURE 3.

Composition of the Juan Fernandez fur seal fecal microbiome at the family level. Only families with >1% relative abundance are shown. (a) Average relative abundance across all samples with standard deviations. (b) Relative abundance per sample grouped by location: EA = El Arenal, BP = Bahia El Padre, PC = Piedra Carvajal, PT = Punta Truenos, SC = Santa Clara, TB = Tierras Blancas, V = Vaqueria
