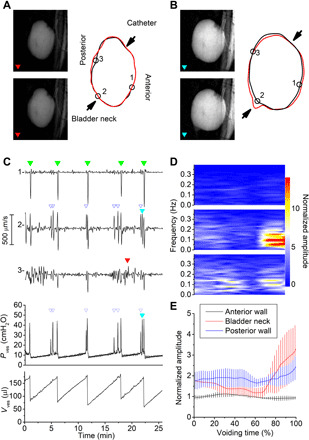
Fig. 2. Videocystometry for the analysis of bladder micromotions.

(A and B) Fluoroscopy images imaged from the lateral side (left) and corresponding bladder circumference (right) illustrating two types of micromotions of the bladder wall: movement of the posterior wall (A) and movement around the bladder neck (B). (C) Time course of the radial velocity of the three border points shown in (A) and (B), PVes and VVes. Time points of individual voids are indicated with solid green triangles, nonvoiding contractions with open blue triangles, and the two events shown in (A) and (B) with filled red and cyan triangles. (D and E) Spectral analysis of bladder wall velocity during the filling phase. In (D), mean spectrograms of the movement of the three indicated bladder points during the filling phase are shown. Short-time Fourier transform analysis was used to produce spectrograms for individual filling periods, which started immediately after one void (voiding time, 0%) and ended just before the next void (voiding time, 100%), and averaged. In (E), the amplitude of the mean spectrograms of n = 5 animals in the spectrum band between 0.05 and 0.2 Hz is shown, normalized to the mean amplitude in the anterior wall. See also movie S2 and fig. S5.
