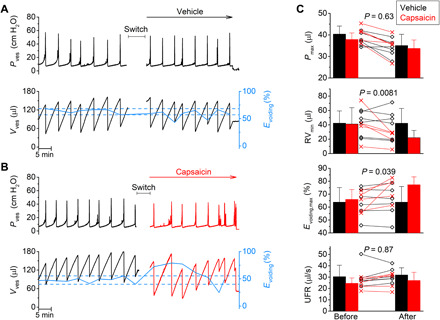
Fig. 3. Videocystometry reveals the acute effect of TRPV1 activation of Evoiding.

(A and B) Pressure and volume traces comparing the effects of intravesical administration of vehicle (A) or the TRPV1 agonist capsaicin (100 μM; B). After a baseline period of 30 min, the intravesical perfusion solution was switched to a solution containing either vehicle or capsaicin. During the switch, recording was stopped during the indicated times. The solid blue line connects the Evoiding for individual voids. Dotted lines indicate the lowest and highest Evoiding during the baseline period. (C) Comparison of videocystometry parameters before and after the switch to either vehicle or capsaicin. Bar charts indicate means ± SD, with data points from individual animals shown along. RVmin and Evoiding,max represent the single lowest residual volume (RV) and single largest Evoiding, respectively, recorded before and after the switch. Statistical comparison of the relative change of the indicated parameters (after/before) between capsaicin-treated (n = 5) and vehicle-treated (n = 6) animals was performed using a two-tailed, unpaired t test. Values for the relative changes (after/before × 100%; vehicle versus capsaicin) were as follows: Pmax, 89.1 ± 8.3 versus 86.6 ± 8.4%; RVmin, 97.0 ± 6.5 versus 57.4 ± 6.8%; Evoiding,max, 99.7 ± 0.3 versus 115.7 ± 7.2%; UFR, 107.6 ± 5.4 versus 109.0 ± 6.4%.
