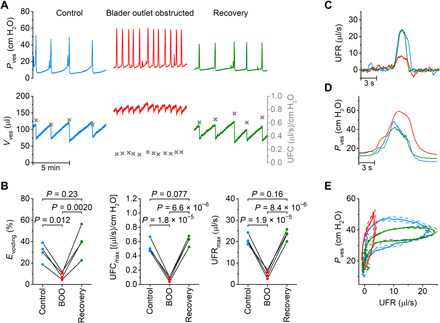
Fig. 4. Videocystometry provides detailed quantification of urethral obstruction.

(A) Representative videocystometry experiment showing the reversible effect of bladder outlet obstruction (BOO) on Pves, Vves, and UFC. (B) Comparison of videocystometry parameters before (control; blue traces), during BOO (red traces) and after recovery (green traces). Statistical analysis was performed using one-way repeated measures analysis of variance (ANOVA) (n = 4). (C and D) Zoomed-in example of UFR and Pves during single voids before, during, and after obstruction. (E) Average pressure-flow trace (±SEM) for the experiment shown in (A), illustrating the reversible change in flow pattern induced by urethral obstruction. See also movie S3.
