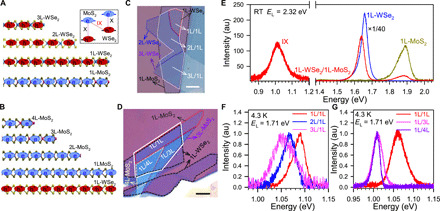
Fig. 1. Observation of IXs in mL-WSe2/1L-MoS2 and 1L-WSe2/mL-MoS2 heterostructures.

(A and B) A schematic of the IXs in mL-WSe2/1L-MoS2 and 1L-WSe2/mL-MoS2 heterostructures (HS), respectively. The inset shows a type II band alignment of WSe2/MoS2 heterostructure [intralayer exciton (X); interlayer exciton (IX)]. For IX, the electrons and holes are separated in MoS2 and WSe2 layers, respectively. (C and D) The optical microscope image of the mL-WSe2/1L MoS2 (labeled as mL/1L; m = 1 to 3) sample (S1) and 1L-WSe2/mL-MoS2 (labeled as 1L/mL; m = 1, 3, and 4) sample (S2). WSe2 and MoS2 with different layers are marked with dashed lines of different colors. The heterostructure regions are marked with solid white lines. Scale bars, 10 μm. (E) The PL spectra of intralayer excitons in monolayer WSe2 and MoS2 and IXs in 1L-WSe2/1L-MoS2 heterostructure sample at room temperature (RT). (F and G) The PL spectra of IXs in mL-WSe2/1L-MoS2 heterostructure and 1L-WSe2/mL-MoS2 heterostructure at low temperature. au, arbitrary units.
