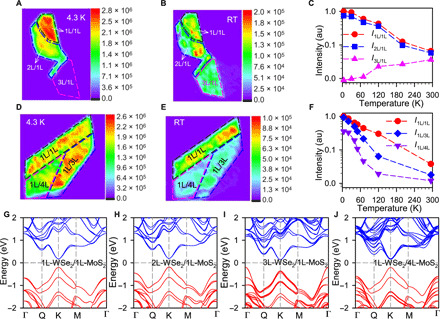
Fig. 2. Temperature dependence of IXs in mL-WSe2/1L-MoS2 and 1L-WSe2/mL-MoS2 heterostructures.

(A and B) The PL intensity map of the IXs in mL-WSe2/1L-MoS2 (mL/1L; m = 1 to 3) HS at 4.3 K and room temperature, respectively. (C) The PL intensity of IXs in mL-WSe2/1L-MoS2 as a function of temperature. The PL intensity is the average values of multiple positions of each mL-WSe2/1L-MoS2 region. (D and E) The PL intensity map of the IXs in 1L-WSe2/mL-MoS2 (mL/1L; m = 1, 3, and 4) HS at 4.3 K and room temperature, respectively. A 1064-nm long pass was used to ensure that only the IX signal can be detected. (F) The PL intensity of IXs in 1L-WSe2/mL-MoS2 as a function of temperature. The PL intensity is the average values of multiple positions of each 1L-WSe2/mL-MoS2 region. (G to J) The calculated electronic energy structure of 1L-WSe2/1L-MoS2, 2L-WSe2/1L-MoS2, 3L-WSe2/1L-MoS2, and 1L-WSe2/4L-MoS2 heterostructures, respectively.
