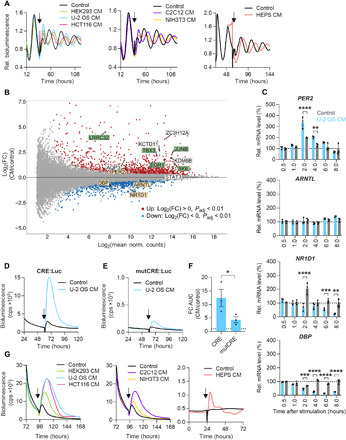
Fig. 4. Secreted factors modulate circadian dynamics via CRE-mediated immediate-early induction of PER2.

(A) Synchronized U-2 OS Per2:Luc reporter cells were stimulated with control medium or CM from indicated cell lines at the trough of PER2 expression (arrow). HEPS, primary hepatocytes). Given are detrended representative time series. (B and C) U-2 OS cells were synchronized and stimulated with U-2 OS CM or control medium at the trough of PER2 expression. (B) RNA was isolated 2 hours after stimulation and used for RNA-seq. MA plot of stimulation-induced log2 expression changes of the U-2 OS transcriptome (yellow boxes, clock genes; green and white boxes, top 10 differentially regulated genes; green boxes, genes associated with TGF-β signaling; n = 2 to 3 with one technical replicate). (C) RNA was isolated after indicated times and reversely transcribed. Given are mRNA expression levels of clock genes analyzed by RT-qPCR (relative to GAPDH and normalized to the unstimulated control, n = 3 with three technical replicates, unpaired t test, **P < 0.01, ***P < 0.001, and ****P < 0.0001). (D to F) U-2 OS CRE:Luc and mutCRE:Luc reporter cells were stimulated with U-2 OS CM or control medium (arrow). (D) Representative time series of CRE:Luc and (E) mutCRE:Luc reporter cells upon stimulation. (F) Quantification of reporter gene induction following CM stimulation (relative to control medium, n = 3 with three to four technical replicates, means ± SEM, unpaired one-tailed t test, *P < 0.05). cps, counts per second; AUC, area under the curve. (G) U-2 OS CRE:Luc reporter cells were stimulated with control medium or CM from indicated cell lines (arrow). Shown are representative time series.
