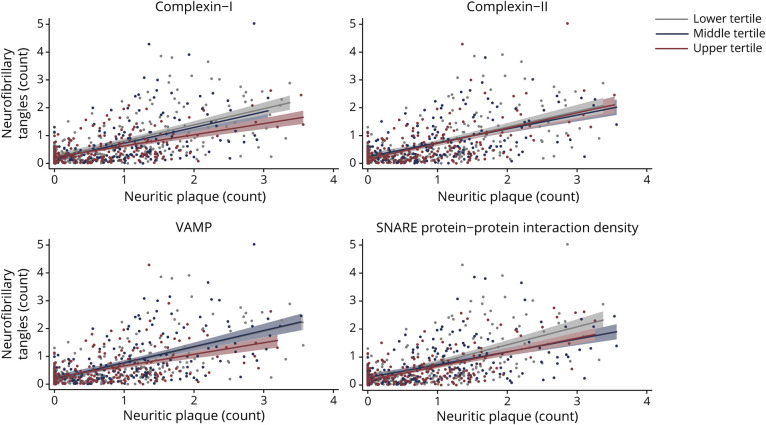
Figure 4. Brain Tissue Levels of Presynaptic Complexin-I, VAMP, and SNARE Protein-Protein Interactions Statistically Moderated the Relationship Between Neuritic Amyloid Plaque and NFT Burden.
Raw values plotted. Synaptic protein values are expressed in log10 units, standardized, and averaged across 6 regions within each participant (z score units). Neuritic plaque and neurofibrillary tangle (NFT) counts were estimated across 5 regions region, scaled by dividing the corresponding SD, and averaged to obtain summary burden counts. All interactions were modeled continuously. Synaptic protein levels were split into sample-based tertiles for illustration purposes.

