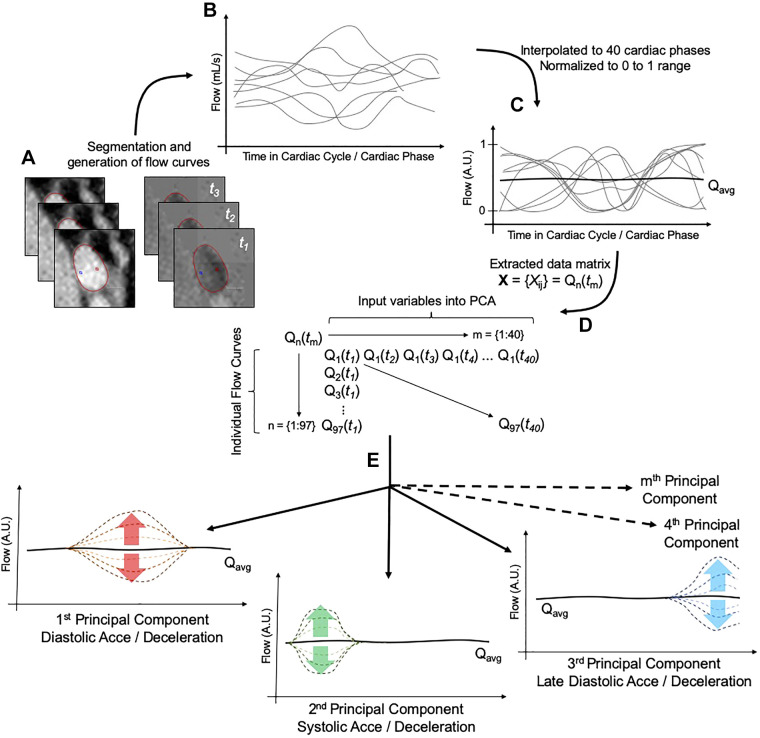
Fig. 1.
Workflow diagram of the principal component analysis (PCA) of the pulmonary arterial flow (Q). A and B: magnitude and phase images acquired by phase-contrast MRI (A) were segmented in parallel to yield patient-specific flow profiles (B). C: generated flow profiles were then preprocessed by temporal interpolation and magnitude normalization. D: finalized matrix of data sets serving as input into PCA consisted of 40 columns representing the time step in cardiac cycle and input variables and 97 rows representing the individual flow curves and sample size. E: generated principal components (here, hypothetically depicted) would then describe a variation from the averaged flow curve (Qavg) at any phase of the cardiac cycle (t). Acce, acceleration; A.U., arbitrary units.

