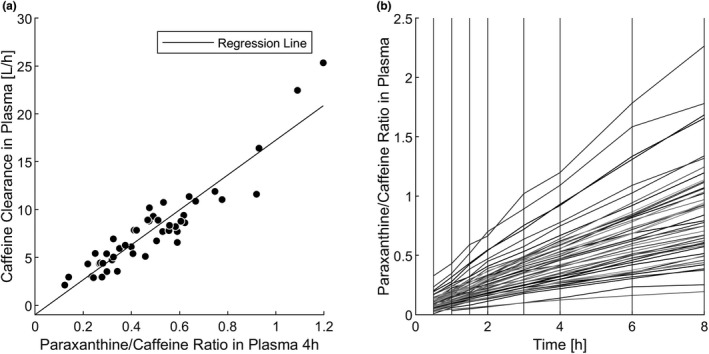
FIGURE 5.

Correlation of observed clearances and paraxanthine/caffeine ratio. (a) Linear regression model with the paraxanthine/caffeine ratio in plasma at 4 h as the explanatory variable and the observed caffeine clearance in plasma as the response variable. (b) Individual time courses of paraxanthine/caffeine ratios in plasma
