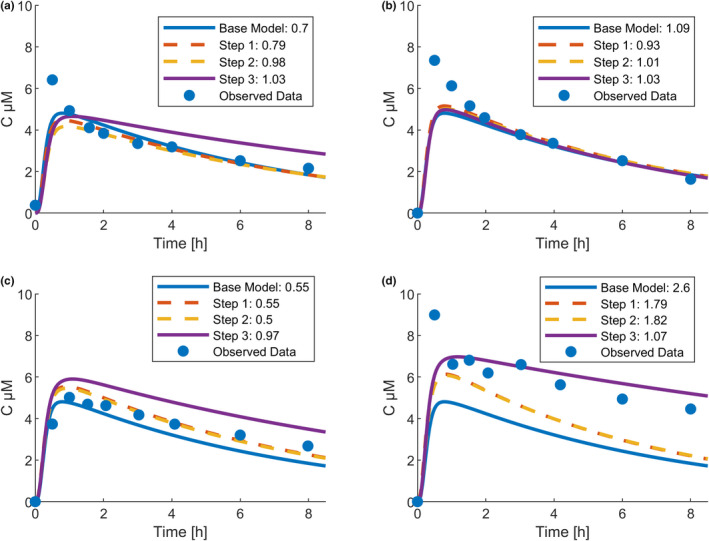
FIGURE 6.

Representative individual caffeine pharmacokinetics. Line colors indicate the respective workflow step, and numeric values in the legend display the corresponding root mean square error: (a) best prediction by base model (male, 42 years old, 179 cm, 83 kg), (b) best prediction by Step 1 (male, 31 years old, 170 cm, 67 kg), (c) best prediction by Step 2 (female, 31 years old, 163 cm, 82 kg), and (d) best prediction by Step 3 (female, 47 years old, 167 cm, 72 kg)
