FIGURE 4.

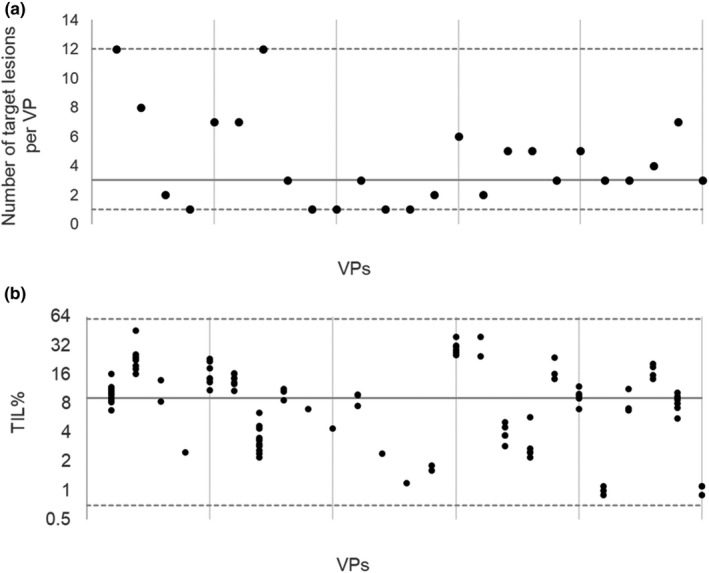
These figures show initial conditions for multiple target lesions for 25 virtual patients (VPs) for clarity (10% of the virtual population [every 10 VP when arranged in the order of their target response as shown in the waterfall], used in this study). Median value for the virtual population (solid line) and minimum and maximum (dashed lines) are shown in the figures (data sources shown in the Supplementary material). Within patient variability for initial tumor infiltrating lymphocyte (TIL% = 100* TIL/[TIL + tumor cells] is set to 25% [heterogeneity of target lesions]). (a) Number of target lesions per VP. (b) Initial TIL% per target lesion. Distribution of number of lesions per VP and initial TIL% for the first lesion of a VP are shown in Figures S3 and S1b
