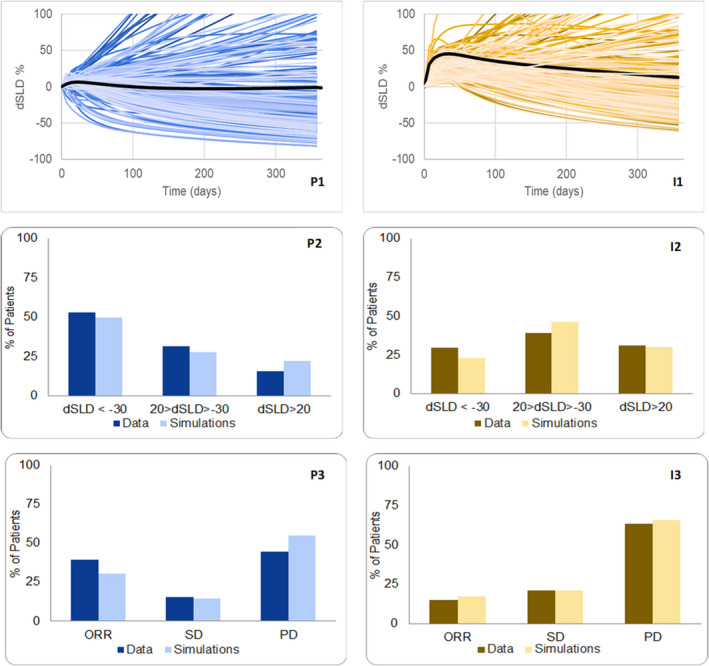
FIGURE 5.

P1 and I1 show the simulated time dynamics over a year of the change in sum of longest diameters (dSLDs) for 250 virtual patients (VPs; each shaded differently) in response to pembrolizumab and ipilimumab, respectively, with median simulated response in a darker shade. Data for buckets of dSLD (<−30, −30 < dSLD < 20, dSLD > 20) are digitized from waterfall plots and are compared against the dSLD from 1 year of simulations, and these are shown in P2 and I2. P3 and I3 show comparison between model and simulation for Response Evaluation Criteria in Solid Tumors (RECIST) scores. The classification of disease progression may be due to target lesion dSLD > 20 during a year and/or a probabilistic event (such as metastases). All data are from ref. 4
