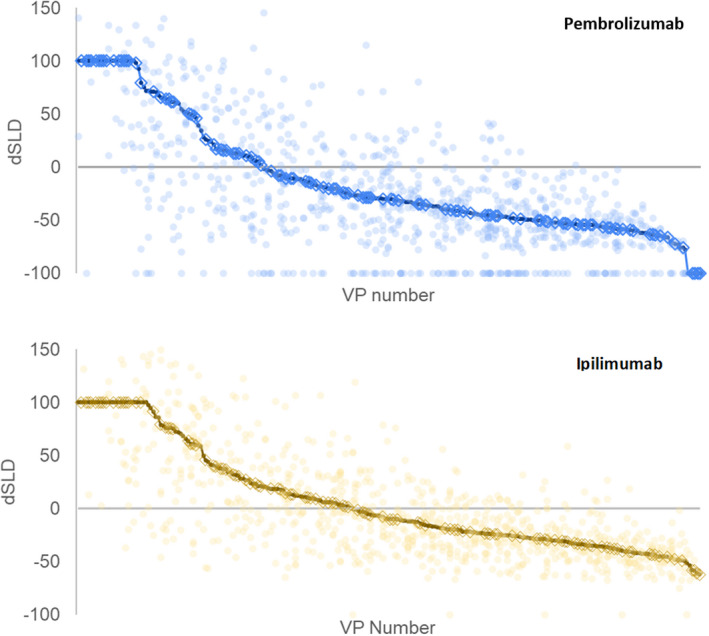
FIGURE 6.

These figures show the behavior for the individual lesions in the 250 virtual patients (VPs). The unbroken line shows the simulated waterfall (change in sum of longest diameters [dSLDs]) for the patients. The lighter dots show the change in tumor size for each of the lesions. The circled VPs are those that were simulated to also have nontarget growth or appearance of metastases
