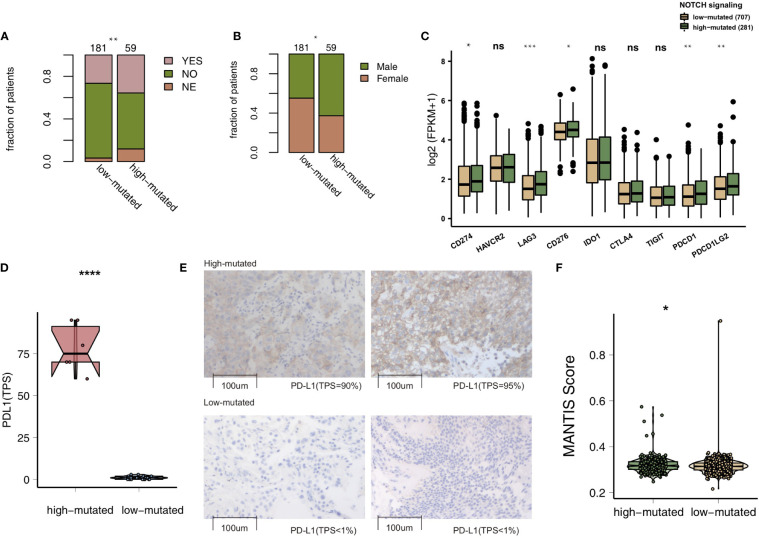
Figure 3.
(A). Bar plot showing the proportion of patients in the MSKCC cohort who experienced durable clinical benefits. (B) Bar plot showing the proportion of patients in the MSKCC cohort according to sex. The range of p-values is presented by the asterisks above the bar plot (*P < 0.05; **P < 0.01; ***P < 0.001; ****P < 0.0001; Fisher’s exact test). (C) Box plots comparing the expression levels of immune checkpoint molecules between the high-mutated and low-mutated NOTCH groups. The range of p-values is presented by the asterisks above each box plot (*P < 0.05; **P < 0.01; ***P < 0.001; ****P < 0.0001; Mann-Whitney U test). (D) Box plots comparing the expression levels of PD-L1 (TPS) between the high-mutated and low-mutated NOTCH groups in the Local cohort (****P < 0.0001; Mann-Whitney U test). (E) Typical cases of the PD-L1 (TPS) level in the high- (2 samples) and low-mutated (2 samples) groups in the Local cohort. (F). Violin plots showing the MANTIS score. The range of p-values is presented by the asterisks above the violin plot (*P < 0.05; **P < 0.01; ***P < 0.001; ****P < 0.0001; Mann-Whitney U test). TPS, tumor proportion score; NSCLC, non-small cell lung cancer; TCGA, The Cancer Genome Atlas; PD-L1, programmed cell death-ligand 1. NS, not significant.

