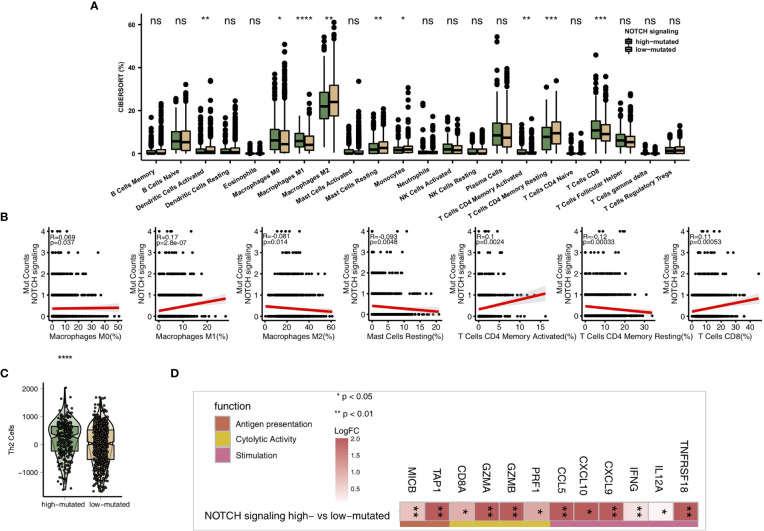
Figure 5.
(A) Comparison of the proportions of immune cells estimated by the CIBERSORT method between the high-mutated and low-mutated NOTCH groups in the TCGA-NSCLC cohort. (B) Correlations between the number of NOTCH signaling mutations and the proportions of each immune cell type. (C) Comparison of the Th2 signature between the high-mutated and low-mutated NOTCH groups in the TCGA-NSCLC cohort. (D) Comparison of the expression levels of immune-related genes between the high-mutated and low-mutated NOTCH groups in the TCGA-NSCLC cohort. (*P < 0.05; **P < 0.01; ***P < 0.001; ****P < 0.0001; Mann-Whitney U test). NS, not significant.

