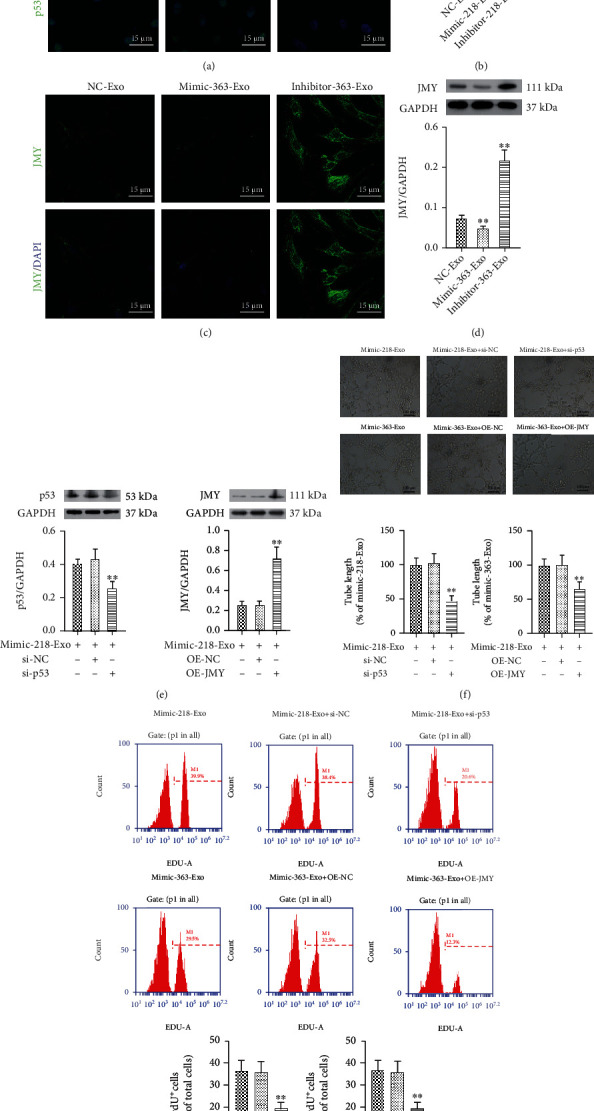
Figure 7.

Effect of miR-218-5p and miR-363-3p on p53/JMY. (a, c) Immunofluorescence staining for the relative expression levels of p53 and JMY in CFs, in the miR-218-5p/miR-363-3p mimic-Exo and inhibitor-Exo groups. (b, d) Western blot analysis to detect the relative expression levels of p53 and JMY in miR-218-5p/miR-363-3p mimic-Exo and inhibitor-Exo groups in CFs, respectively. The photographs were taken with a laser confocal microscope (Zeiss, LSM700), magnification: 120x. The data are presented as the mean ± SD (n = 3). ∗P < 0.05 and ∗∗P < 0.01, mimic-Exo or inhibitor-Exo versus NC-Exo. (e) Western blot analysis to detect the relative expression levels of p53 and JMY in si-p53 and OE-JMY CF groups, respectively. The data are presented as the mean ± SD (n = 3). ∗∗P < 0.01, si-p53 or OE-JMY group versus mimic-218-Exo or mimic-363-Exo group. (f) The tube formation capability and relative tube length were decreased in the si-p53 and OE-JMY groups. The data are presented as the mean ± SD (n = 3). ∗∗P < 0.01, si-p53 or OE-JMY group versus mimic-218-Exo or mimic-363-Exo group. (g) BrdU labelling and flow cytometry assay to detect the effect of si-p53 and OE-JMY on cell proliferation. The data are presented as the mean ± SD (n = 3). ∗∗P < 0.01, si-p53 or OE-JMY group versus mimic-218-Exo or mimic-363-Exo group.
