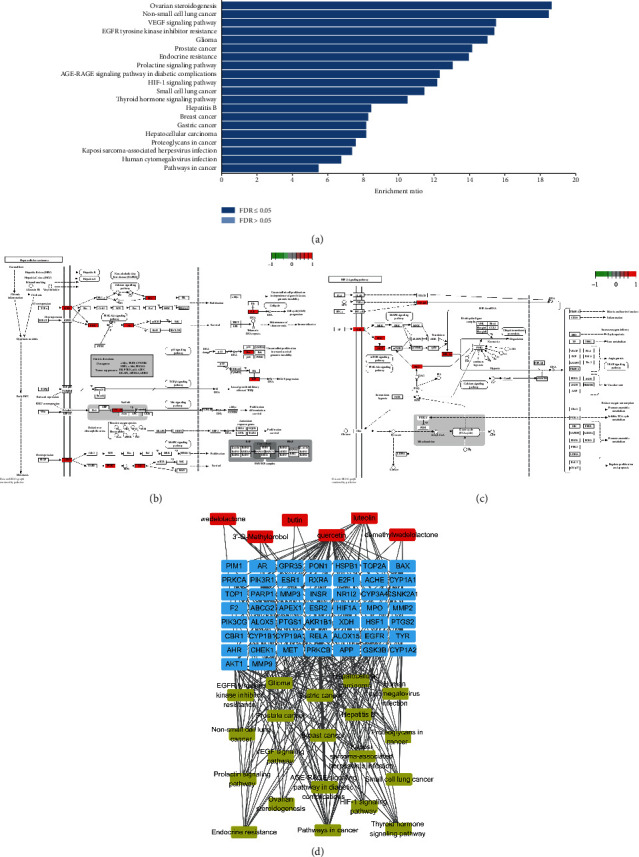
Figure 6.

Kyoto Encyclopedia of Genes and Genomes (KEGG) pathway enrichment analysis and C-T-P network analysis. (a) Bar chart of the top 20 KEGG pathways. (b) Pathway diagram of EH acting on HCC through the hepatocellular carcinoma pathway. The nodes in red represent targets that EH may regulate in this pathway. (c) Pathway diagram of EH acting on HCC through the HIF-1 signaling pathway. The nodes in red represent targets that EH may regulate in this pathway. (d) C-T-P network. Nodes represent the compounds (red), the targets (blue), and the top 20 KEGG pathways (yellow). The edges represent compound-target and target-pathway interactions.
