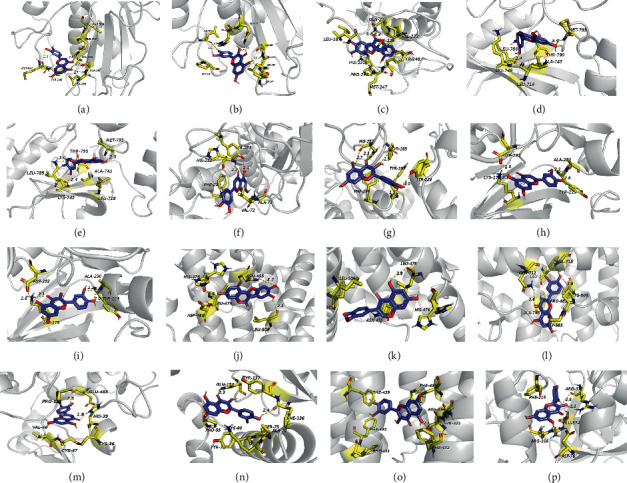
Figure 7.

The 3D interaction diagram of the compound and the target was analyzed by the molecular docking method and displayed by PyMoL 1.8. Compounds (purple), residue (yellow), hydrogen bonding (dotted line). (a) Luteolin-MMP9. (b) Quercetin-MMP9. (c) Wedelolactone-MMP9. (d) Luteolin-EGFR. (e) Quercetin-EGFR. (f) Luteolin-RELA. (g) Quercetin-RELA. (h) Luteolin-AKT1. (i) Quercetin-AKT1. (j) Demethylwedelolactone-ESR1. (k) 3′-O-Methylorobol-ESR1. (l) Luteolin-AR. (m) Luteolin-PTGS2. (n) Quercetin-AHR. (o) Quercetin-ABCG2. (p) Quercetin-CYP3A4.
