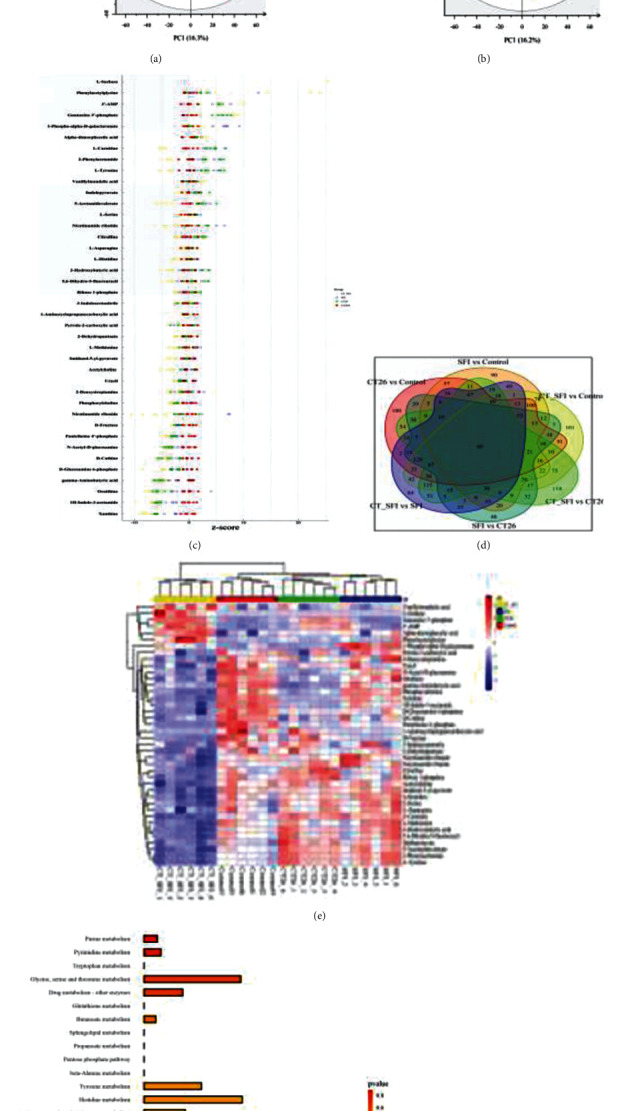
Figure 3.

Metabolomics analysis identified possible metabolism targets in the C2C12 cells for SFI. (a, b) PCA and PLS-DA analysis in the negative and positive modes. The different colors represent the different groups (red for the control, yellow for CT-26 + SFI, blue for SFI, and green for CT-26, and this also applies to the colors in (c, e)). (c) Z-score plot of the metabolites. (d) Venn diagram showing the counts and diversity of the metabolites in the different groups, and there are 40 common metabolites across all groups. (e) Heat map analysis of the 40 differential metabolites, the degree of change is marked with different colors; each row represents a single sample, and each column represents a metabolite. (f) Metabolic pathway analysis of the potential biomarkers. (g) The network of potential metabolites for pathway analysis-based genes, red represents the pathway, yellow represents the metabolites, and blue represents the related genes.
