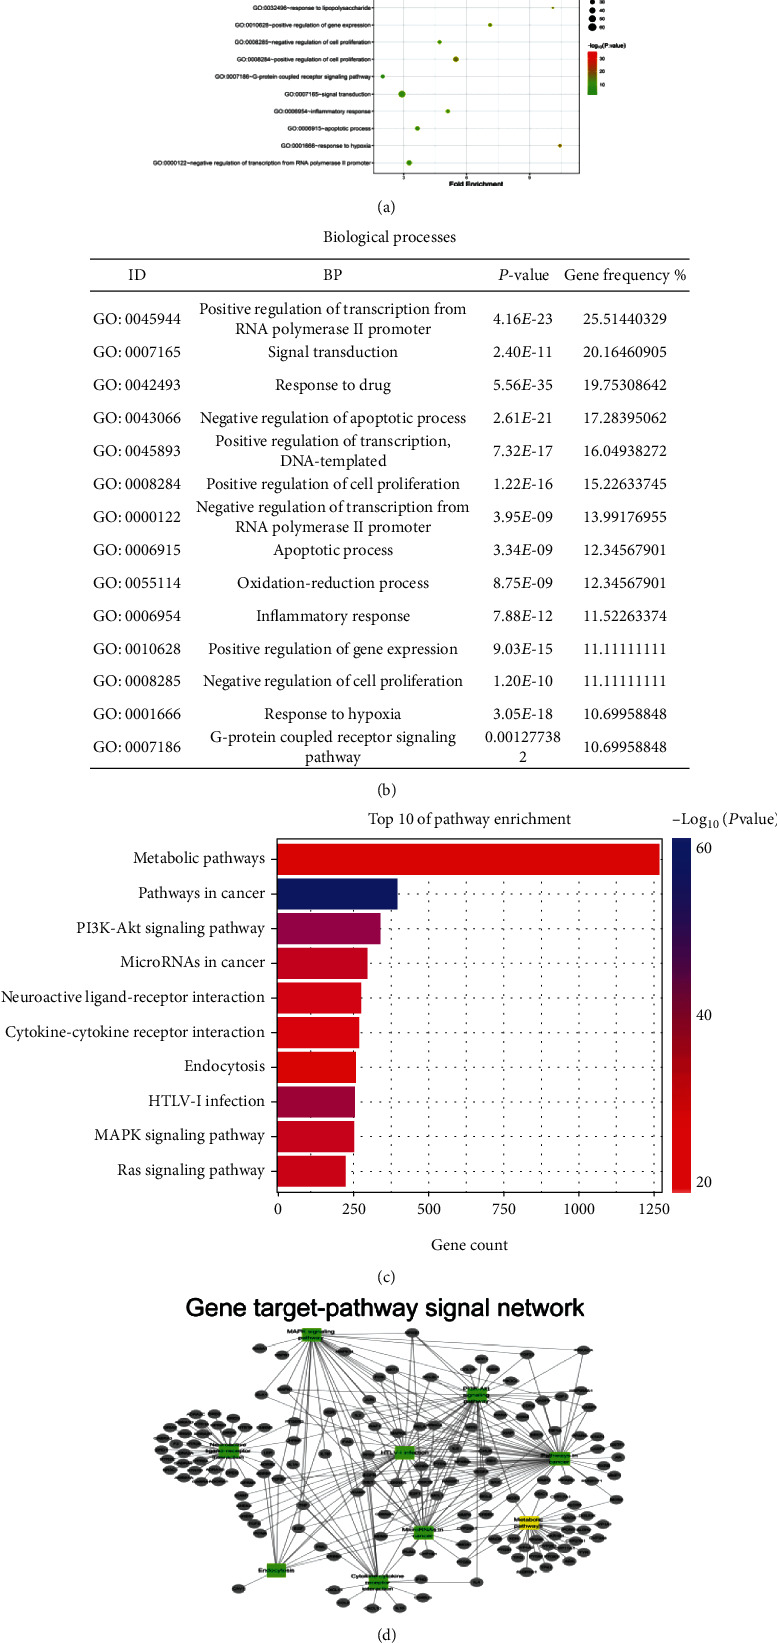
Figure 5.

Gene Ontology (GO) and KEGG Pathway enrichment analysis of the SFI compound targets/CRF-related targets: (a) molecular functions; (b) biological processes; (c) pathway enrichment analysis. The colors represent the different adjusted P values < 0.05, while the size of the circles represents the count. (d) Gene target-pathway signal network. The grey ellipse represents the different gene targets, and the square colors represent the pathways.
