Figure 1.
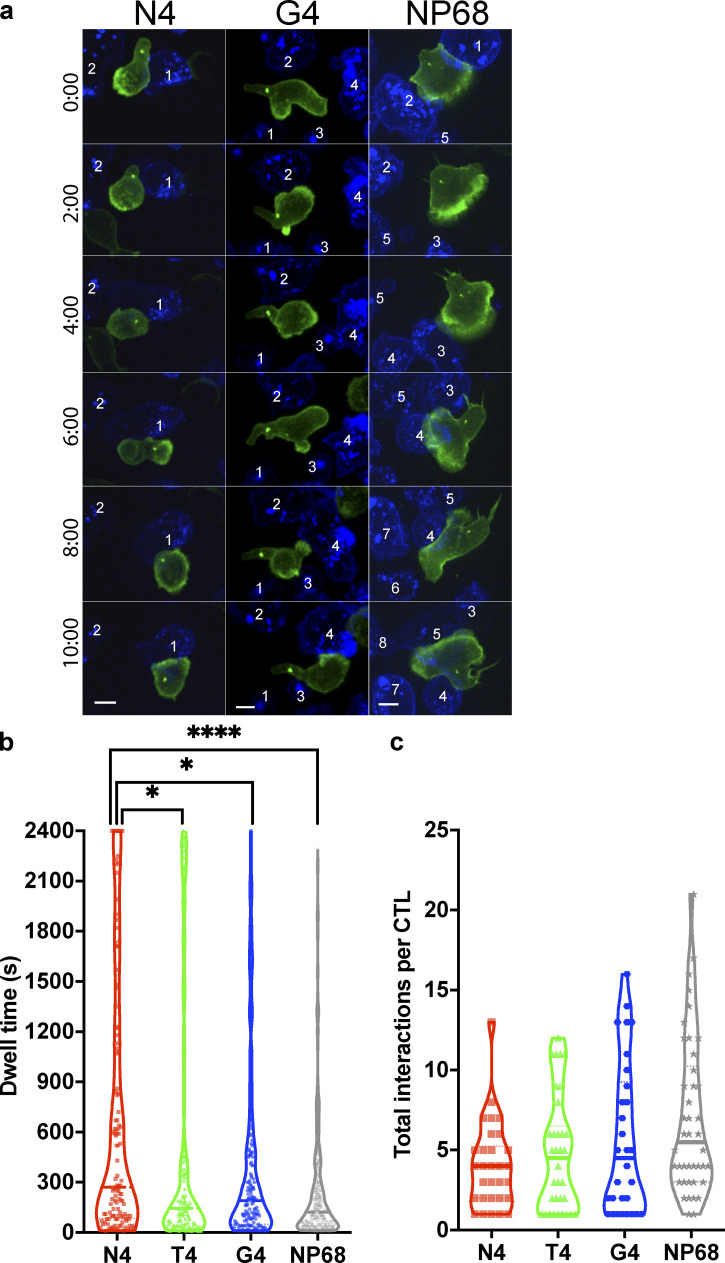
Increasing TCR signal strength increases CTL dwell time. (a) OTI CTLs expressing Lifeact-mApple (green) and RFP-PACT (green sphere) interacting with EL4 (blue), pulsed with N4, T4, G4, or NP68 peptides. Representative time series of OTI CTLs encountering targets, numbered sequentially. Scale bars = 5 µm. (b) Violin plot showing dwell times for individual CTLs with targets; number of interactions N4 n = 121, T4 n = 128, G4 n = 169, NP68 n = 294; bars represent median with quartiles. A Bonferroni-corrected Mann–Whitney test was used for statistical analysis. *, P < 0.5; ****, P < 0.0001. (c) Data from (b) were used to calculate the mean number of interactions per CTL per time series and plot the mean per independent video (N4 n = 30, T4 n = 34, G4 n = 30, NP68 n = 42). Bars represent median with quartiles.

