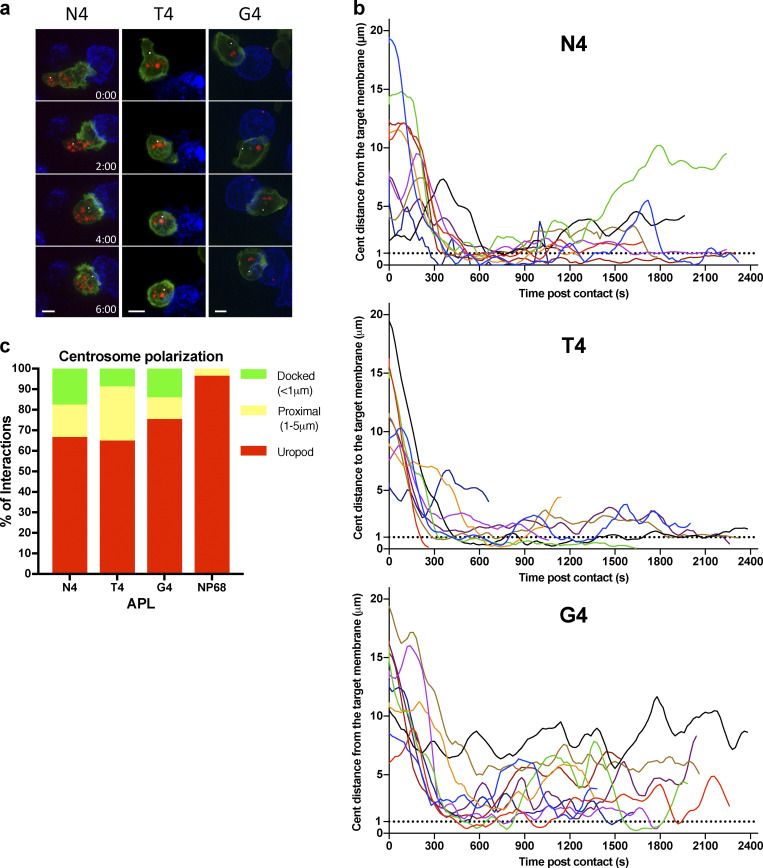
Figure 3.
Increasing TCR signal strength increases centrosome (cent) docking at the synapse. GzmB-TdTomato (red) OTI CTLs expressing Lifeact-EGFP (green) and BFP-PACT (white sphere) interacting with EL4 (blue), pulsed with N4, T4, G4, or NP68 peptides. (a) Representative maximum-intensity projection time series of OTI CTLs encountering targets. Scale bars = 5 µm; time min:s after contact with target. (b) Segmented centrosome distances to synapse measured across the duration of the interaction for n = 10 (N4, G4) or n = 9 (T4) independent CTL–target interactions, with each color representing a different CTL. (c) OTIs expressing LifeAct-mApple and RFP-PACT were imaged every 10 s over 40 min interacting with EL4-blue, pulsed with N4, T4, G4, or NP68. The closest approach of the centrosome to the target cell membrane per interaction was classified as in the uropod (>5 µm), proximal (1–5 µm), or docked (<1 µm). Results from five independent experiments, with CTL N4 = 58, T4 = 57, G4 = 80, and NP68 = 126, and total interactions analyzed, N4 = 121, T4 = 129, G4 = 169, and NP68 = 284.

