Figure 5.
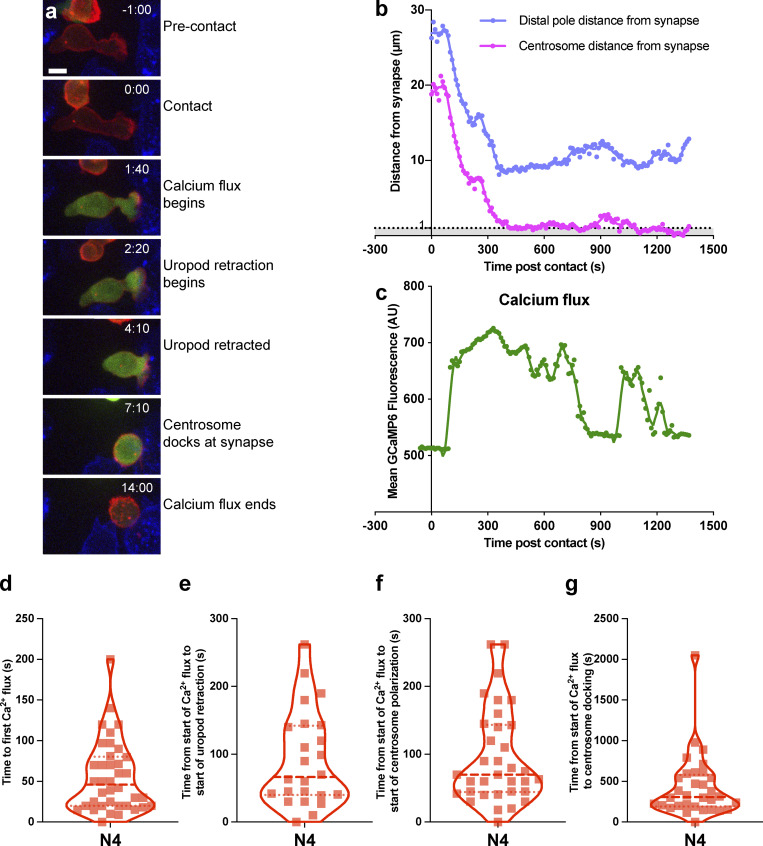
Calcium flux precedes centrosome polarization and uropod retraction. OTI CTLs expressing GCAMP6m (green), Lifeact-mApple (red), and RFP-PACT (red sphere) interacting with EL4 (blue), pulsed with N4. (a) Representative maximum-intensity projection time series of OTI CTLs encountering N4 pulsed target. Scale bars = 5 µm; time min:s after contact with target. (b and c) Example cell from (a) segmented using Imaris to measure the distance of the distal pole (blue) and centrosome (red) to the synapse (b), and the mean GCaMP6m fluorescence within the CTL (c). (d–g) Violin plots of time from contact to first calcium flux (d; n = 38), the time from the start of the calcium flux to start of uropod retraction (e; n = 24), start of centrosome polarization toward synapse (f; n = 34), and centrosome docking at the synapse (g; n = 32).

