Figure 6.
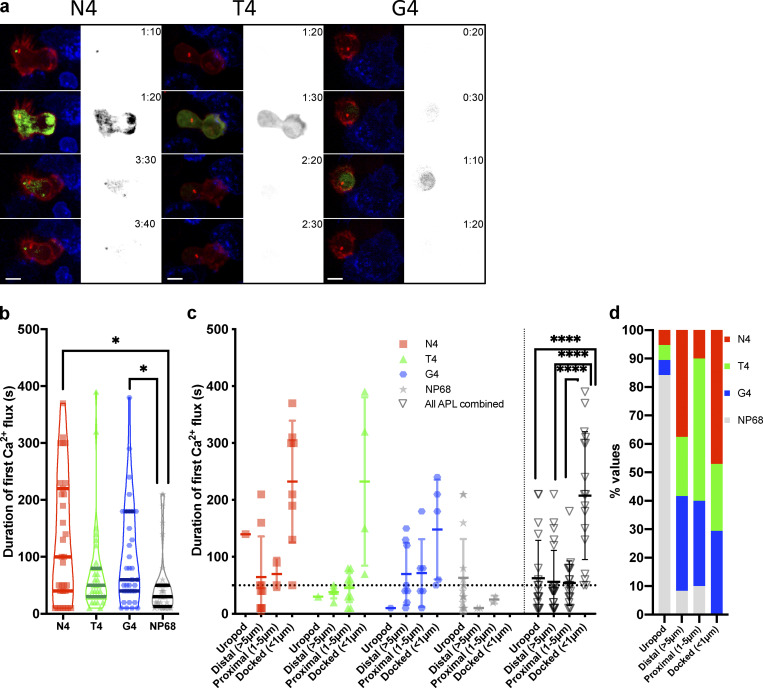
Duration of initial calcium fluxes are increased with higher-affinity ligands. OTI CTLs expressing GCAMP6m (green), Lifeact-mApple (red), and RFP-PACT (red sphere) interacting with EL4 (blue), pulsed with N4, T4, or G4. (a) Representative maximum-intensity projection time series of OTI CTLs encountering APL pulsed targets. Scale bars = 5 µm; time min:s after contact with target (right, monochrome) fluorescence in the GCaMP6 channel. (b and c) The duration of the first increase in GCaMP6 fluorescence within an interaction (b; N4 n = 31, T4/G4 n = 35, and NP68 n = 36). Bars show medians with quartiles duration of the first increase in GCaMP6 fluorescence within an interaction (c; n = 20/APL downsampled from [b]). Measurements have been grouped in (c) and (d) by the APL presented by the target (symbol/color) and by the closest approach of the centrosome to the target membrane. Bars show mean ± SD. (d) All data from (c) combined to show the percentage of cells for each APL with a given centrosome position. Statistics: Bonferroni-corrected Mann–Whitney test. *, P < 0.05; ****, P < 0.00001.

