Figure 2.
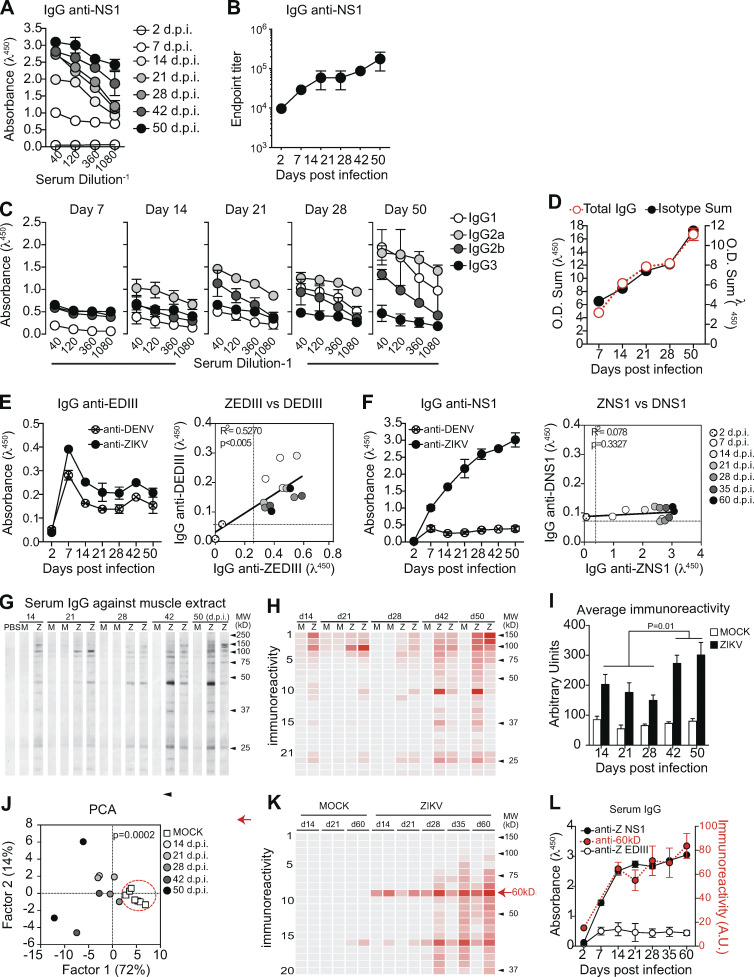
Humoral immune response to NS1 during ZIKV infection correlates with autoreactive antibodies. (A) Binding of serum IgG to ZIKV NS1 protein during infection detected by ELISA. (B) Endpoint titer of serum IgG specific to ZIKV NS1 protein after infection. (C) NS1-specific serum IgG isotype composition during experimental infection were detected by antigen-specific ELISA. (D) Total NS1-specific IgG in serum corresponds to the sum of IgG isotypes, present in distinct proportions after infection. O.D., optical density. (E and F) Sera from ZIKV-infected mice (1:120 dilution) were tested by ELISA for binding to ZIKV and DENV antigens EDIII (E) and NS1 (F). Correlation coefficients show cross-reactivity of EDIII-specific IgG, but not of NS1-specific IgG. Correlations were computed as Pearson’s correlation coefficients. (G) Self-reactivities present in serum IgG (diluted 1:100) from control (M) and infected (Z) mice using muscle extract from BALB/c mice as source of self-antigens. (H) Intensity of bands was quantified and plotted as a heat map. (I) Total immunoreactivity (sum of all bands intensities) present in the sera of infected (ZIKV) and control (MOCK) mice for each time point after infection. Statistical analyses were performed using two-tailed Student’s t test. (J) Principal-component analysis (PCA) of all self-reactivities at all time points. Circle indicates the segregation of the control group. Statistical analyses were performed using two-tailed Student’s t test to compare factor 1 scores of MOCK vs ZIKV. (K) Intensity of reactivities present in serum IgG (diluted 1:100) from control (MOCK) and infected mice (ZIKV) using HEp-2 cell extract as source of self-antigens. (L) Intensity of the reactivity to a selected 60-kD self-antigen throughout time after infection correlates with levels of serum IgG specific to ZIKV NS1 protein, but not with levels of IgG specific to domain III of ZIKV envelope protein (ZEDIII). A.U., arbitrary units. Data for A and B are from one experiment with three mice per group. Data for C and D are from one experiment representative of two independent experiments with 5–16 mice per group. Data for E, F, K, and L are from one experiment representative of two independent experiments with two to three mice per group. Data for G–J are from one experiment representative of two independent experiments (two representative samples per group are shown). Error bars represent SEM.

