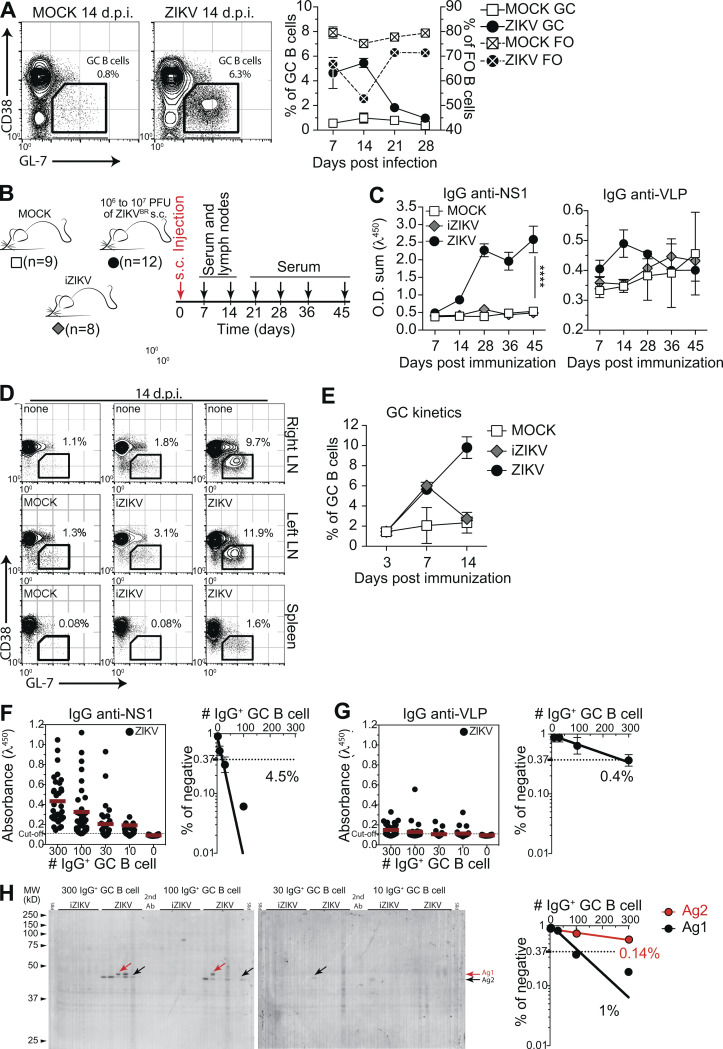
Figure 3.
GC B cells produce both virus-specific and autoreactive antibodies. (A) GC B cells (CD38lo/− GL-7+ gated on B220+ CD138−) in the spleen of ZIKV-infected mice at 14 d.p.i. (left). Kinetics of frequencies of FO and GC B cells after infection (right). (B) s.c. infection experimental design indicating the time points of serum samples and lymphoid tissue collections from control mice (MOCK), mice immunized with UV-iZIKV, and infected mice (ZIKV). (C) Kinetics of serum IgG specific to ZIKV NS1 and VLPs. O.D. sum is the summation of ODs of four serum dilutions (1:40, 1:120, 1:360, and 1:1,080). Statistical analyses were performed using two-tailed Student’s t test. ****, P ≤ 0.0001. (D) Representative plots of GC B cells (CD38lo/− GL-7+ gated on B220+ CD138−) at day 14 after infection. Mice were injected in the left footpad. (E) Kinetics of frequency of GC B cells in left popliteal LNs after infection (ZIKV) or immunization (iZIKV). (F–H) GC B cells from popliteal LNs of infected mice were sorted, pooled, and cultured in decreasing numbers per well (300, 100, 30, and 10 cells per well). Supernatants were collected on day 7 and screened for IgG secretion by ELISA. Supernatants that revealed the presence of IgG were tested for antigen specificity by ELISA (F and G) or immunoblot against mouse brain tissue as source of self-antigens (H). Frequencies of IgG+ GC B cells that bound NS1 (F), VLP (G), or self-antigens (H) were calculated using Poisson distribution. Self-antigen reactivities used for frequency determination are indicated by arrows (antigen 1, black; antigen 2, red). Cell culture was performed on a monolayer of gamma-irradiated (20 Gy) NB21 feeder cells (Kuraoka et al., 2016; 3 × 10³ cells/well) and LPS (30 µg/ml). Ab, antibody; AG, antigen; MW, molecular weight. Data for A are from one experiment representative of two independent experiments with 8–16 mice per group. Data for D and E are from one experiment representative of two independent experiments with six to nine mice per group. Data for F and G are from one experiment representative of two independent experiments with three mice per group. Data for H are from a single experiment with three mice per group. GC B cells were pooled in culture. Error bars represent SEM.

