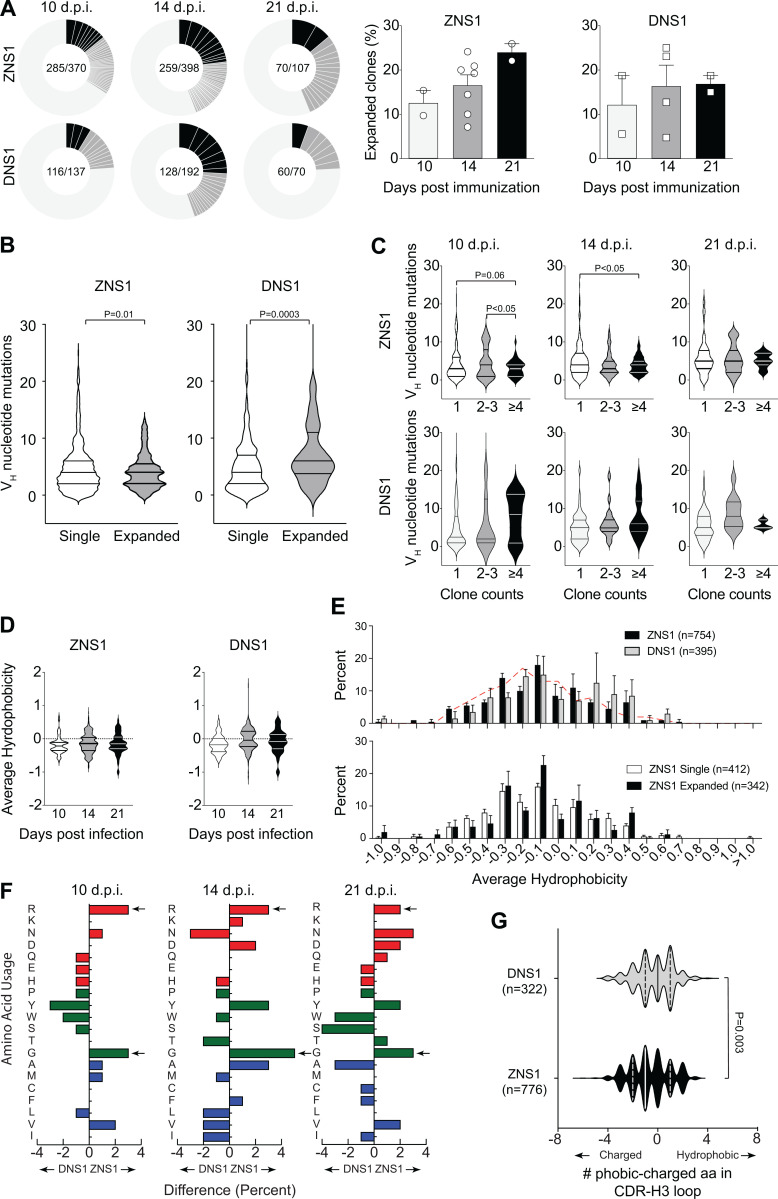
Figure 5.
Characterization of B cell repertoire present in GCs after ZIKV NS1 immunization. (A) Single GC B cells from mice immunized s.c. with recombinant ZIKV NS1 or DENV NS1 were sorted at indicated time points after immunization, and Igh gene was sequenced. Pie charts represent clonal diversity found in all LNs analyzed. Slices represent clonotypes assigned based on VH and JH usage and CDR-H3 length and sequence. Slice size is proportional to the frequency of each clone. Black slices indicate clone counts higher than four. Dark gray slices indicate clone counts of two or three. Light gray where slices are not delimited represents single clones. Proportion of expanded clones is indicated on the right. (B) Number of somatic mutations found in VH segments separated by singletons versus expanded clones. (C) Number of somatic mutations found in VH segments at different time points separated by clone count. (D) CDR-H3 average hydrophobicity index variation among all sequences at indicated time points after immunization. (E) Comparison of CDR-H3 average hydrophobicity index distribution among all sequences from mice immunized with ZIKV NS1 or DENV NS1 (upper panel) and comparison between expanded (clonotypes found more than once in the same LN) and single clones from mice immunized with ZIKV NS1 (lower panel). Dashed red line indicates the distribution of CDR-H3 average hydrophobicity in FO B cells from WT BALB/c mice. The normalized Kyte–Doolittle hydrophobicity scale (Kyte and Doolittle, 1982) was used to calculate average hydrophobicity. (F) Divergence in the distribution of individual amino acid usage in the CDR-H3 loop between ZNS1- and DNS1-immunized mice at each time point. Red bars indicate charged amino acids, green bars represent neutral amino acids, and blue bars represent hydrophobic amino acids. Arrows indicate enrichment in arginine (R) and glycine (G) in ZIKV NS1 CDR-H3 loops. (G) Difference in number of hydrophobic and charged amino acids among all sequences from DENV NS1–immunized mice (gray) and ZIKV NS1–immunized mice (black). GC B cells were sorted and sequenced from individual LNs and pooled for analyses (two to four mice per group from two independent experiments).Statistical analyses were performed using the unpaired two-tailed Student’s t test. Error bars represent SEM.

