Figure 6.
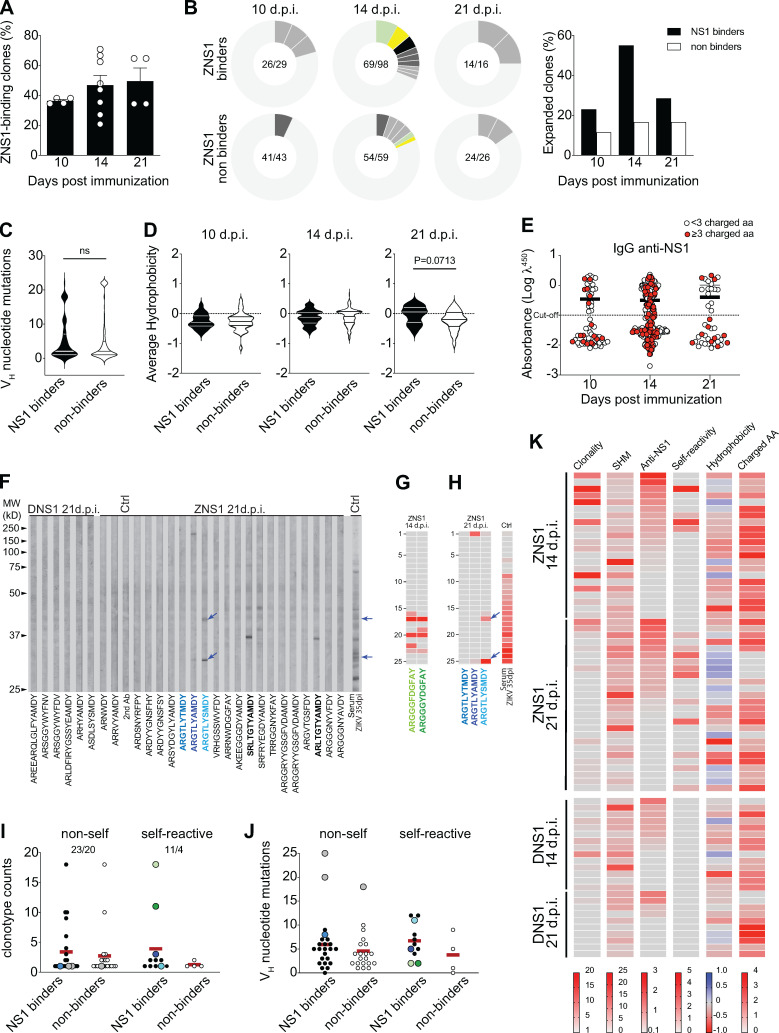
Self-reactivity of GC B cells after ZIKV NS1 immunization. Single GC B cells were sorted and cultured on a monolayer of gamma-irradiated NB21 feeder cells (103 cells/well; Kuraoka et al., 2016). After 7 d, supernatants were collected for binding assays, and cells were harvested for Igh sequencing. (A) Frequency of IgG+ single GC B cell culture supernatants that bound to ZIKV NS1 per LN. IgG+ wells were tested for binding to ZIKV NS1 protein by ELISA. (B) Clonal distribution of GC B cells found to bind to NS1 (upper panel) or that did not bind to NS1 (lower panel). Size of the slice is proportional to the clone frequency. Colored slices represent variants of clones that were found both as binders and nonbinders. Right panel represents the frequency of expanded clones among binders and nonbinders at specific time points after immunization. (C) Number of somatic mutations found in VH segments from each GC B cell sequenced grouped based on binding to NS1. (D) CDR-H3 average hydrophobicity index variation at different time points grouped by binding to NS1. Statistical analyses were performed using the unpaired two-tailed Student’s t test. (E) NS1 binding by ELISA OD related to the presence of charged amino acids. Red dots indicate the presence of three or more charged amino acids in CDR-H3 at different time points. (F–I) Single GC B cell culture supernatants were tested for binding to self-antigens by immunoblot. (F) Representatives immunoblot profiles of monoclonal IgG from single GC B cell culture supernatants binding to mouse brain extract. Arrows indicate immunoreactivities highlighted in the main text. (G) Immunoreactivity profile of two poly-reactive variants from the clonal family bearing “glycine-enriched CDR-H3” (ARGGGYDGFAY) found among GC B cells from mice 14 d.p.i. with ZIKV NS1. (H) Immunoreactivity profile of the autoreactive clonotype ARGTLYAMDY and its two more mutated variants, ARGTLYTMDY (nonautoreactive) and ARGTLYSMDY (autoreactive). (I) Clonotype counts of NS1 binders (black dots) and NS1 non binders (white dots) separated by self-reactivity. Color-coded dots represent variants of clones described in the main text. (J) Number of somatic mutations found in VH segments grouped by binding to NS1 and self-reactivity. Color coded dots represent variants of clones described in the main text. (K) Clonality, SHM, binding to NS1, self-reactivity, hydrophobicity, and charged amino acid usage by time after immunization. Clonality corresponds to the number of variants of each clonotype found in the dataset. SHM is represented by the number of VH mutations found in each sequence. Anti-ZNS1 indicates the OD obtained by ELISA. Self-reactivity corresponds to the number of bands found for each supernatant in mouse tissue extracts (brain and/or muscle). Hydrophobicity corresponds to the average hydrophobicity of the CDR-H3 loop, and hydrophobic and charged CDR-H3 sequences are shown in blue and red, respectively. Charged AA indicates the number of charged amino acids found in the CDR-H3 loop. GC B cells were sorted and sequenced from individual LNs and pooled for analyses (two to four mice per group from two independent experiments). Error bars represent SEM.

