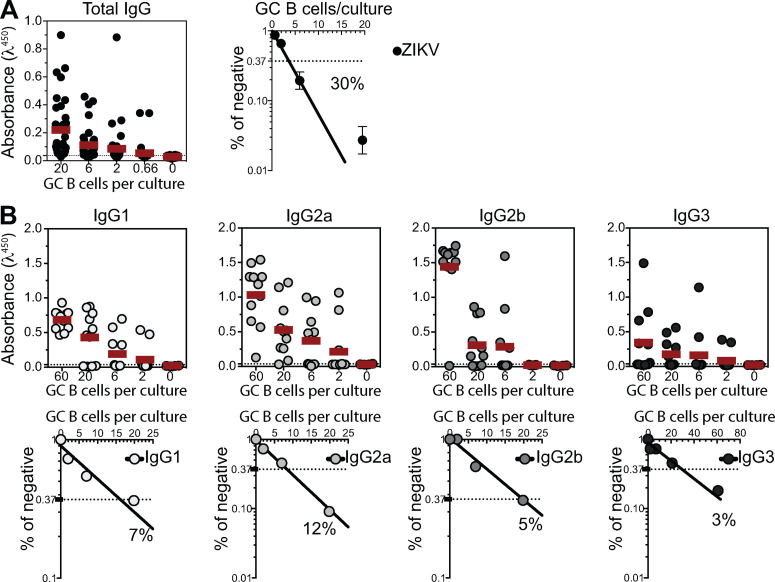
Figure S3.
Quantification of the number of responding GC B cell clones per culture. GC B cells from popliteal LNs of ZIKV-infected mice were sorted and cultured in decreasing average number of cells per well (60, 20, 6, 2, and 0.66 cells/well). Supernatants were collected on day 7 and screened for IgG secretion by ELISA. (A) Frequency of GC B cell clones secreting total IgG per culture in response to polyclonal stimuli were calculated using Poisson distribution. (B) Culture supernatants were used to estimate the frequency of GC B cell clones secreting each BALB/c IgG subclass (IgG1, IgG2a, IgG2b, and IgG3). Cell culture was performed on a monolayer of gamma-irradiated (20 Gy) NB21 feeder cells (Kuraoka et al., 2016; 3 × 10³ cells/well) and LPS (30 µg/ml). Data from one experiment with three mice per group. GC B cells from all mice in each group were pooled in culture.

