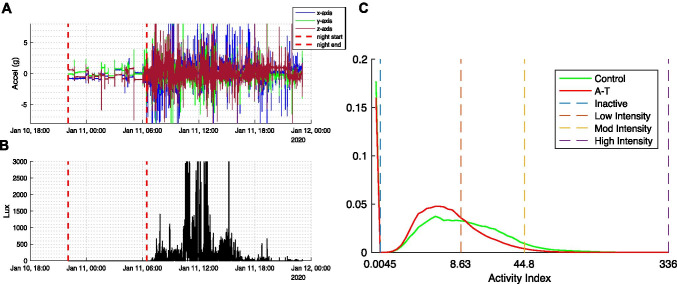
Fig. 1.
Sample of raw acceleration data and Activity Index (AI) histogram for A-T participants and controls. A–B Tri-axial acceleration and light measurements from a sample participant over 24 h. Dashed lines separate nighttime and daytime segments. C Histograms show the proportion of daytime participants spent at each AI (group medians shown). X-axis plotted in cubic scale. Dashed lines denote the upper bound of AI categories defined as inactive (AI < 0.0045), low (0.0045–8.63), moderate (8.63–44.8), and high (44.8–336)

