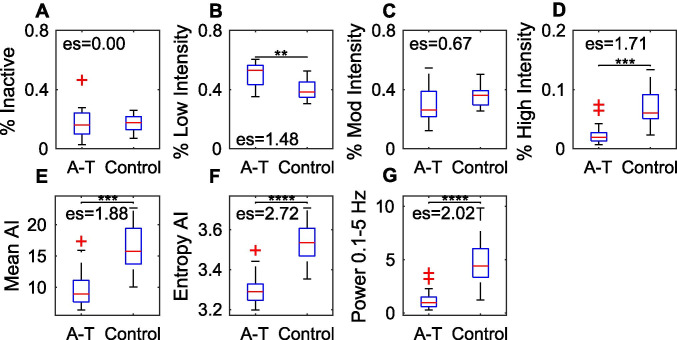
Fig. 2.
Differentiating A-T versus controls based on daytime activity. A–D Proportion of daytime spent in each Activity Index (AI) category; E mean AI; F entropy of AI; and G total power (0.1–5 Hz) in A-T versus control groups. Levels of significance are indicated: p < 0.05(*); p < 0.01(**); p < 0.001(***); p < 0.0001(****)

