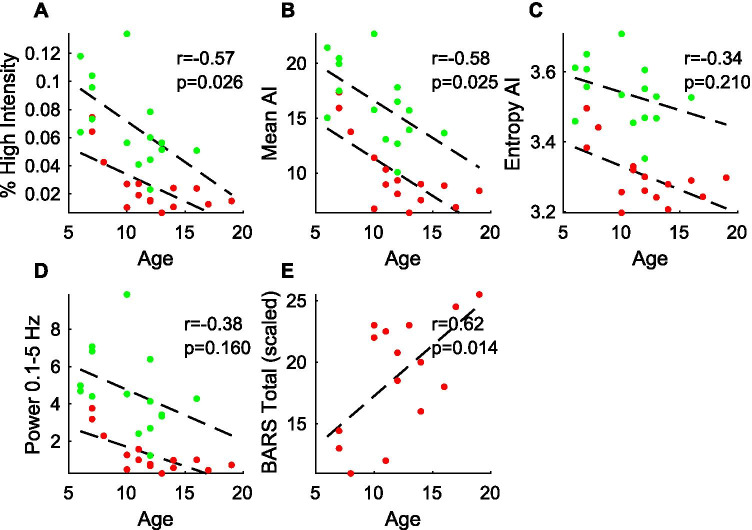
Fig. 5.
Relationship between wearable sensor metrics and age. A–D The four activity metrics of interest were plotted against participant age with A-T (red) and control (green) participants shown separately. Linear regression line through each group is shown and listed Pearson correlation coefficients (r) and p-values are based on control group data only. E Total BARS score in the A-T group is plotted with respect to age and the corresponding regression line is shown

