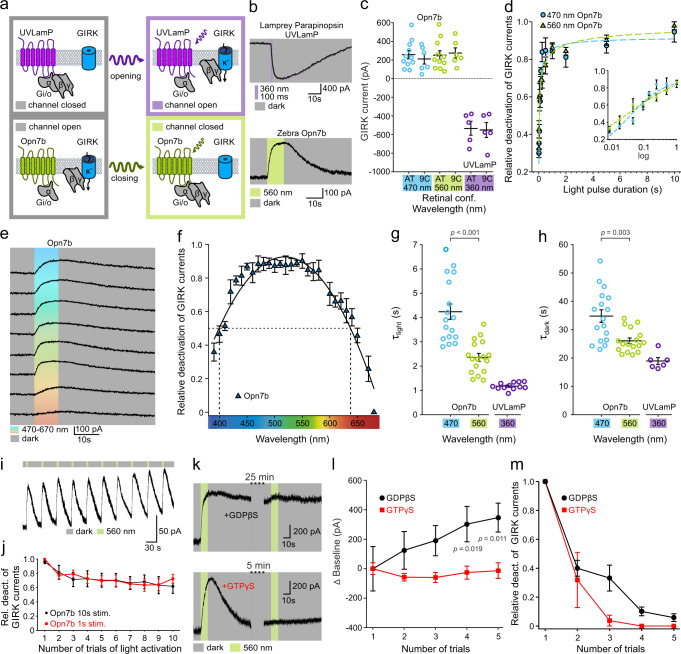
Fig. 1. Opn7b constitutively activates the Gi/o pathway in HEK293 cells.
a Schematic representation of Gi/o mediated (de-)activation of G protein-coupled inwardly rectifying potassium (GIRK) channels illustrating the reverted functionality of Opn7b (bottom) in contrast to classical G protein-coupled receptor (GPCR)-type opsins (top); i.e., lamprey parapinopsin (UVLamP). Typical GPCR-type opsins convert from their dark-adapted, stable resting or inactive state to their G protein-activating state upon photon absorption (monostable) or interconvert between both states in a light-dependent manner (multistable). In contrast to both groups, the monostable Gi/o-coupled Opn7b exhibits a dark-adapted, stable G protein-activating state and is inactivated upon photon absorption. b Patch-clamp recording example traces of GIRK currents. The classical Gi/o-coupled GPCR-type opsin UVLamP induces G protein-mediated opening of co-expressed GIRK channels (inward K+ current under given experimental conditions) upon light stimulation. In contrast, under the same experimental conditions, in darkness, Gi/o-coupled Opn7b leads to sustained G protein-mediated opening of co-expressed GIRK channels that are closed upon light stimulation. c Comparison of light (de-)activated GIRK current amplitude for UVLamP (n = 5 cells) and Opn7b (all-trans n = 11 cells, 9-cis n = 6 cells), using all-trans (AT) or 9-cis (9 C) retinal and light of the indicated wavelengths. Mean values (±SEM) and single-cell data (circles) are shown. d Light pulse duration dependence of Opn7b inactivation using light of the indicated wavelengths. Mean values (± SEM) are shown (n = 4 cells per group). e Patch-clamp recording example traces of GIRK currents for Opn7b at different wavelengths. f Action spectrum depicting the wavelength dependence of Opn7b inactivation. Mean values (±SEM) are shown (n = 5 cells). g Comparison of light-induced GIRK current (de-)activation time constants (τlight) for Opn7b (n = 17 cells) and UVLamP (n = 12 cells) at the indicated wavelengths. Mean values (±SEM) and single-cell data (circles) are shown (two-sided Mann–Whitney-U-test). h Comparison of darkness-induced post-stimulus GIRK current (de-)activation time constants (τdark) for Opn7b (n = 17 cells) and UVLamP (n = 6 cells) at the indicated wavelengths. Mean values (±SEM) and single-cell data (circles) are shown (two-sided Mann–Whitney-U-test). i Patch-clamp recording example traces of GIRK currents for repetitive activation of Opn7b. j Relative GIRK current amplitude for repetitive activation of Opn7b. Mean values (±SEM) are shown (10 s stim n = 5 cells, 1 s stim n = 6 cells). k Patch-clamp recording example traces of GIRK currents for Opn7b under pipette-mediated (intracellular) application of guanosine diphosphate beta S (GDPβS, top) or guanosine triphosphate gamma S (GTPγS, bottom) at different time points after establishment of whole-cell configuration. l Comparison of GIRK current baseline for repetitive activation of Opn7b under application of GDPβS (black) or GTPγS (red) at different time points after establishment of whole-cell configuration. Mean values (±SEM) are shown (n = 5 cells per group; two-way repeated measure ANOVA followed by Bonferroni test, F(1,8) = 4.881, p = 0.058). m Relative GIRK current amplitude for repetitive activation of Opn7b under application of GDPβS (black) or GTPγS (red) at different time points after establishment of whole-cell configuration. Mean values (±SEM) are shown (n = 5 cells per group). Source data are provided as a Source Data file.

