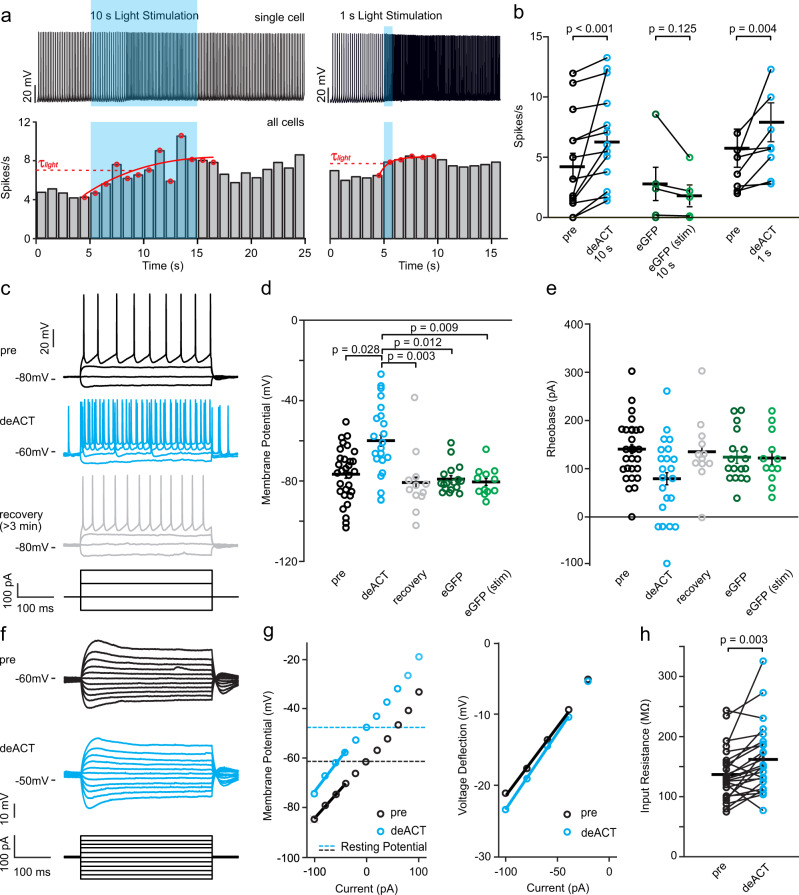
Fig. 2. Blue light stimulation of Opn7b increases neuronal activity in vitro.
a Example recordings of two neurons (10 s and 1 s; top). Neurons were held in current clamp (pre) and stimulated with 470 nm blue light (blue box). Light stimulation increased the firing rate of all firing Opn7b-expressing neurons (10 s: n = 13 cells from 11 animals and 1 s: n = 8 cells from 11 animals; bottom). Time constant of activation (τlight) of light-induced maximum firing rate is shown in red. b Mean response rate of Opn7b-expressing cells increased by light-induced deactivation (deACT) of Opn7b with blue light (10 s: n = 13 cells from 11 animals; 1 s: n = 8 cells from 11 animals). In contrast, light stimulation did not change the firing rate of enhanced green fluorescent protein (eGFP)-expressing neurons (n = 5 from 2 animals). Mean values (±SEM) and single-cell data were plotted, significance was assessed using two-sided Wilcoxon signed-rank test. c Example trace of a neuronal response to a −100, 0, 100, and 200 pA pulse before stimulation (pre), direct after light-induced deACT of Opn7b and after a recovery time of at least 3 min after stimulation (recovery). d Comparisons of membrane potentials in Opn7b-expressing neurons before (pre, black, n = 30 from 12 animals) and after light stimulation (blue, deACT, n = 22 cells from 11 animals and gray, recovery, n = 12 cells from 5 animals) and eGFP-expressing neurons before and after light stimulation (green, eGFP: n = 17 cells from 2 animals, eGFP-stim: n = 12 cells from 2 animals). Mean values (± SEM) and single-cell data (circles) are shown. Significance was assessed using Kruskal-Wallis-test (p < 0.001) followed by pairwise Dunn’s test. e Comparisons of rheobase in Opn7b-expressing neurons before (pre, black, n = 30 cells from 12 animals) and after light stimulation (blue, deACT, n = 22 cells from 11 animals; and gray, recovery, n = 12 cells from 5 animals) and eGFP-expressing neurons before and after light stimulation (green, eGFP: n = 17 cells from 2 animals; eGFP-stim: n = 12 cells from 2 animals). Mean values (±SEM) and single-cell data (circles) are shown. Significance was assessed using Kruskal-Wallis-test (p = 0.099). f Example trace of a neuronal response to various small current steps from −100 to 100 pA pulse before stimulation (pre) and direct after deACT used to calculate the input resistance. g I-V plot generated from the voltage response before (black) and after light-induced deactivation (blue) shown in (f). The average input resistance was estimated from the slope of the I-V plot between −100 and −40 pA. h Mean input resistance of Opn7b-expressing cells increased by light-induced deACT with blue light (n = 24 cells from 11 animals). Mean values (±SEM) and single-cell data were plotted, significance was assessed using two-sided Wilcoxon signed-rank test. Source data are provided as a Source Data file.

