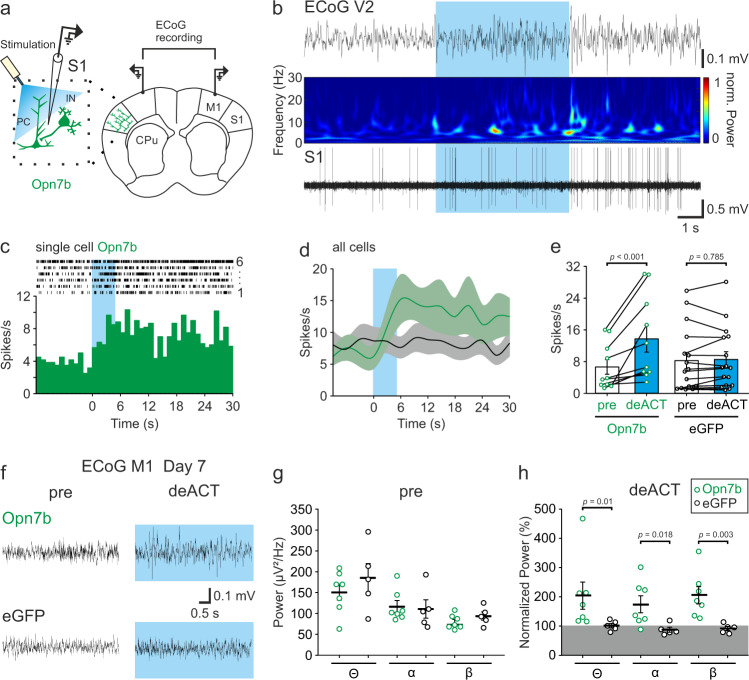
Fig. 3. Blue light stimulation of Opn7b increases neuronal and network activity in vivo.
a Schematic description of the unilateral light stimulation site, bilateral electrocorticographic (ECoG) recording site and simultaneous single-cell recording in awake head restrained Opn7b expressing (green) mice. Pyramidal cell (PC); Interneuron (IN); Primary motor cortex (M1); Primary somatosensory cortex (S1); Caudate putamen (CPu). b Example trace depicting a change in activity in the secondary visual cortex (V2) ECoG recording (top), corresponding spectral analysis (middle) and simultaneously recorded single-cell activity (bottom) in the primary somatosensory cortex (S1) after 5 s blue light (465 nm) stimulation on day 10 after injection. c Example raster plot (top) and peri-stimulus time histogram of a single cell in S1 (same one as depicted in B) stimulated with 5 s blue light (blue box) for 6 repetitive trials. Bin size 1 s. d Stimulation increased the single-cell activity in S1 neurons for Opn7b but not enhanced green fluorescent protein (eGFP; gray) expressing cells (Opn7b n = 10 cells from 3 animals, eGFP n = 16 cells from 3 animals). Solid line represents the mean, while shadowed area represents the ±SEM. e A significant (repeated measure two-way ANOVA followed by pairwise Bonferroni test, F(1,24) = 21.494, p < 0.001) increase in the mean spike rate (±SEM) upon blue light stimulation (deACT 12 s, blue) compared to pre-stimulation (pre 12 s, white) was found for Opn7b but not eGFP expressing cells. Each circle (Opn7b n = 10 cells from 3 animals, eGFP n = 16 cells from 3 animals) represents an individual cell, while the bar represents the mean. Error bars represented as ±SEM. f Example trace of ECoG activity in M1 before stimulation and during stimulation of Opn7b (top) or eGFP (bottom). g No changes were found in the ECoG activity in the theta, alpha and beta frequency band before stimulation in Opn7b (n = 7 animals) and eGFP (n = 5 animals). h A significant increase in normalized (normalized to pre activity) theta, alpha, and beta (two-sided Mann–Whitney-U-test) frequency-band activity was detectable for Opn7b (n = 7 animals) stimulated Bl6 mice in comparison to eGFP (n = 5 animals) stimulated Bl6 mice on day 7. Each circle represents individual animals, while the bar represents the mean. Error bars represented as ±SEM. Source data are provided as a Source Data file.

