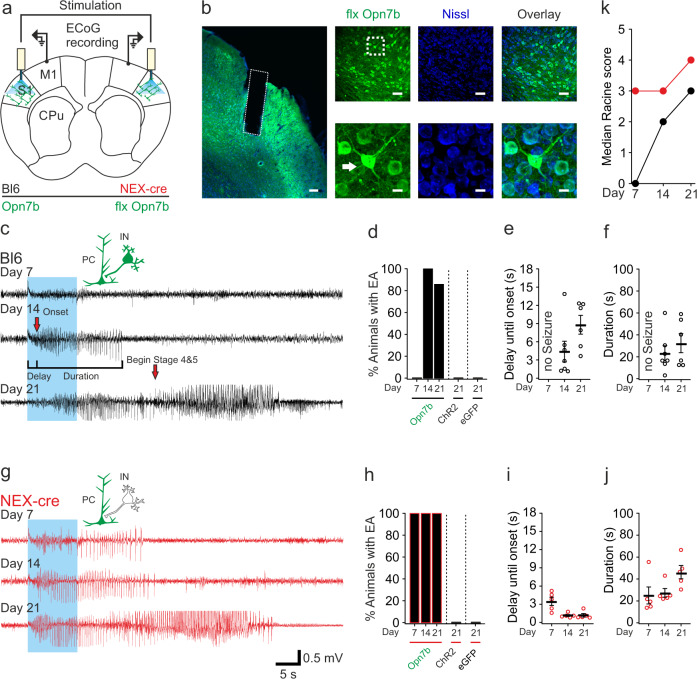
Fig. 4. Light-mediated deactivation of Opn7b in primary somatosensory cortex induces epileptiform activity in mice.
a Schematic description of the bilateral electrocorticographic (ECoG) recording in M1. For simultaneous light stimulation, bilateral optic fibers were implanted in the primary somatosensory cortex (S1) after viral injection. Primary motor cortex (M1); Caudate putamen (CPu). b Representative example of floxed (flx) Opn7b (green) expression in S1 and general neuronal staining (Nissl, blue) in NEX-cre mice. The dashed box in the left panel represents the fiber tract of the implanted fiber. Scale bar 100 µm. The dashed box in the right top panel is a zoom of a single neuron and its axon (arrow) in the bottom panel. Scale bar 50 µm top panel and 10 µm bottom panel. c Bl6 mice (black trace) and (g) NEX-cre mice (red trace) were recorded weekly and stimulated with 10 s blue light (465 nm, blue box). c First epileptiform activities (EAs) were detectable on day 14 after virus injection following stimulation in Bl6 mice expressing Opn7b and (g) on day 7 in NEX-cre mice in ECoG recordings and video recordings. Pyramidal cell (PC); Interneuron (IN). d Bars represent the percentage of Bl6 mice (n = 7 animals) and (h) NEX-cre (n = 5 animals) mice that developed EA after light stimulation. None of the Bl6 controls expressing channelrhodopsin-2 (ChR2, n = 3 animals) or enhanced green fluorescent protein (eGFP, n = 5 animals) showed pathological ECoG changes upon light stimulation. NEX-cre mice developed EA on every recording day following floxed Opn7b stimulation, while none of the NEX-cre floxed ChR2 (n = 3 animals) or floxed eGFP mice (n = 8 animals) developed EA upon light stimulation. e, i The delay until onset of EA was measured at the time between stimulation onset and the beginning of ECoG EA (see c). Bl6 day 14 n = 7, day 21 n = 6 and Nex-cre day 7–21 n = 5. f, j The EA lasted around 30 s for Bl6 and NEX-cre mice. Bl6 day 14 n = 7, day 21 n = 6 and Nex-cre day 7–21 n = 5. k The severity of EA was measured as the median value of the modified Racine scale which was higher on day 7 in NEX-cre mice than in Bl6 mice. Bl6 day 7–21 n = 7 and Nex-cre day 7–21 n = 5. Each circle represents individual EA, while the bar represents the mean value for all animals. Error bars represented as ±SEM. Source data are provided as a Source Data file.

