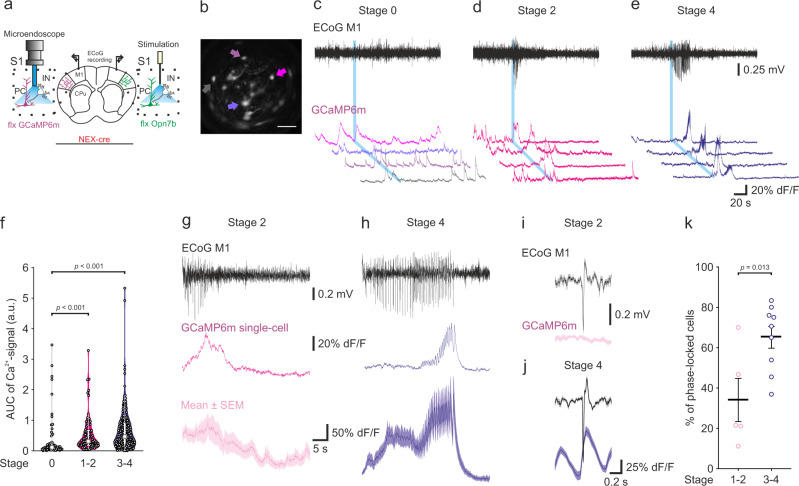
Fig. 5. Calcium dynamics of Opn7b induced epileptiform activity synchronize with electrocorticogram activity.
a Schematic example of unilateral injection and stimulation site for floxed (flx) Opn7b (green), bilateral electrocorticographic (ECoG) recording site and unilateral injection and recording of floxed GCaMP (purple) using a microendoscope in primary somatosensory cortex (S1) of NEX-cre mice. Primary motor cortex (M1); Caudate Putamen (CPu); Pyramidal cell (PC); Interneuron (IN). b Representative maximum projection of Ca2+ signals in S1. Colored arrows represent cells shown in C1 bottom. Scale bar 100 µm. Recording of epileptiform activity (EA, Top) and unilateral recording of Ca2+ activity (GCaMP6m, bottom) after blue light (465 nm, 1 s) stimulation revealed varying Ca2+ activity for stage 0 (c), 1-2 (d) and 3-4 (e) EA. f Area under the curve (AUC) for the Ca2+ signal following blue light stimulation was significantly increased for EA of stage 1–2 (n = 86 cells from 5 EAs in 2 animals) and stage 3–4 (n = 180 cells from 9 EAs in 2 animals) in comparison to stage 0 (no EA, n = 62 cells from 2 animals, Kruskal-Wallis-test followed by pairwise Dunn’s test, p < 0.001). Small black circles represent individual cells, large gray circle representing median, white box 25th and 75th percentile and whiskers 5th and 95th percentile. g Representative example of stage 2 EA in the ECoG recording (Top, black), the Ca2+ activity of an individual cell (middle) and mean activity of all recorded cells during the EA (bottom, n = 18 cells) and (h) stage 4 mean Ca2+ activity (n = 20). g and h solid line represents mean, while shadowed area represents the ±SEM. i Example of peak triggered average for EA (top, ECoG M1) and its corresponding average Ca2+ signal (bottom, GCaMP6m) showed low phase locking of the Ca2+ signal with the EA for stage 2 (n = 13 peaks, same EA as depicted in g). j but high phase-locking for stage 4 EA (n = 50 peaks, same EA as depicted in h). Solid line represents mean, while shadowed area represents the ±SEM. k The percentage of phase-locked cells during EA is significantly higher during stage 3–4 EA (n = 9 EAs from 2 animals) than during stage 1–2 EA (n = 5 EAs from 2 animals, t(12) = −2.903 two-sided independent samples t test). Each circle represents individual EA, while the bar represents the mean value for all. Error bars represented as ±SEM. Source data are provided as a Source Data file.

