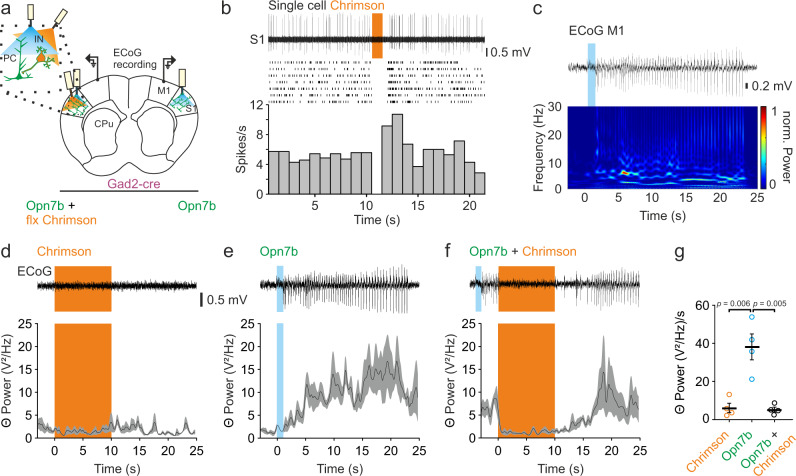
Fig. 6. Bilateral suppression of epileptiform activity by unilateral excitation of inhibitory interneurons.
a Schematic example of bilateral electrocorticographic (ECoG) recording, bilateral injection and stimulation site for Opn7b (green) and unilateral injection and stimulation site for floxed (flx) Chrimson (expression only in GABAergic interneurons, due to Gad2-cre animals, orange). Pyramidal cell (PC); Interneuron (IN); Primary somatosensory cortex (S1); Primary motor cortex (M1); Caudate putamen (CPu). b Representative example of single-cell activity of a putative PC in S1 during Chrimson stimulation of GABAergic interneurons with orange light (620 nm, 1 s; top) and corresponding raster plot (middle, 7 Trials from 1 cell) as well as peri-stimulus time histogram. Bin size 1 s. c Spectral characteristics of generalized epileptiform activity (EA) induced by Opn7b stimulation showed increased activity in the theta frequency band (4–8 Hz). d Change in mean theta power in the M1 after 10 s orange light or (e) 1 s blue light (465 nm) stimulation. Blue light stimulation induced generalized EA which was detectable by the increase in theta power. The top panel shows a representative ECoG trace example. f Mean theta power was bilaterally decreased (depicted is the contralateral side of Chrimson stimulation) during excitation of GABAergic interneurons in S1 if an EA was induced by 1 s blue light stimulation. For (d–f) bottom black line represents mean (n = 4) while gray area represents the ±SEM. g Mean theta power during 5 s of activity during orange light stimulation (no EA, n = 4), blue light stimulation (EA, n = 4) and orange light stimulation (n = 4) during EA (Chrimson during EA). Mean theta power during Opn7b alone was significantly higher than Chrimson alone and if Chrimson was activated after EA onset (one-way repeated measure ANOVA followed by pairwise Bonferroni test F(2,6) = 18.262, p = 0.003). Each circle represents individual animals, while the bar represents the mean value for all animals. Error bars represented as ±SEM. Source data are provided as a Source Data file.

