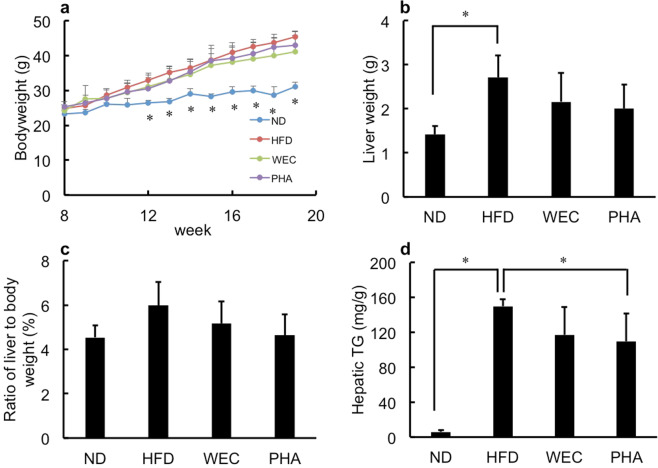
Fig. 1. The effects of WEC and PHA on bodyweight and liver wight.
Bodyweight change (a), liver weight (b), ratio of liver weight to bodyweight (c), and hepatic triglyceride levels (d) in the normal diet-fed (ND), high-fat diet-fed (HFD), Chlorella pyrenoidosa water extract-treated (WEC), and phenethylamine-treated (PHA) groups. The WEC and PHA groups were fed on HFD and administered with WEC (100 mg/kg bodyweight) and PHA (10 μg/kg bodyweight), respectively. Data are represented as mean ± standard deviation (n = 6). The means were compared using analysis of variance, followed by Dunnett’s test. *p < 0.05 vs. HFD group.

