
Fig. 3. Decoding the role of the TATA box on promoter dynamics.
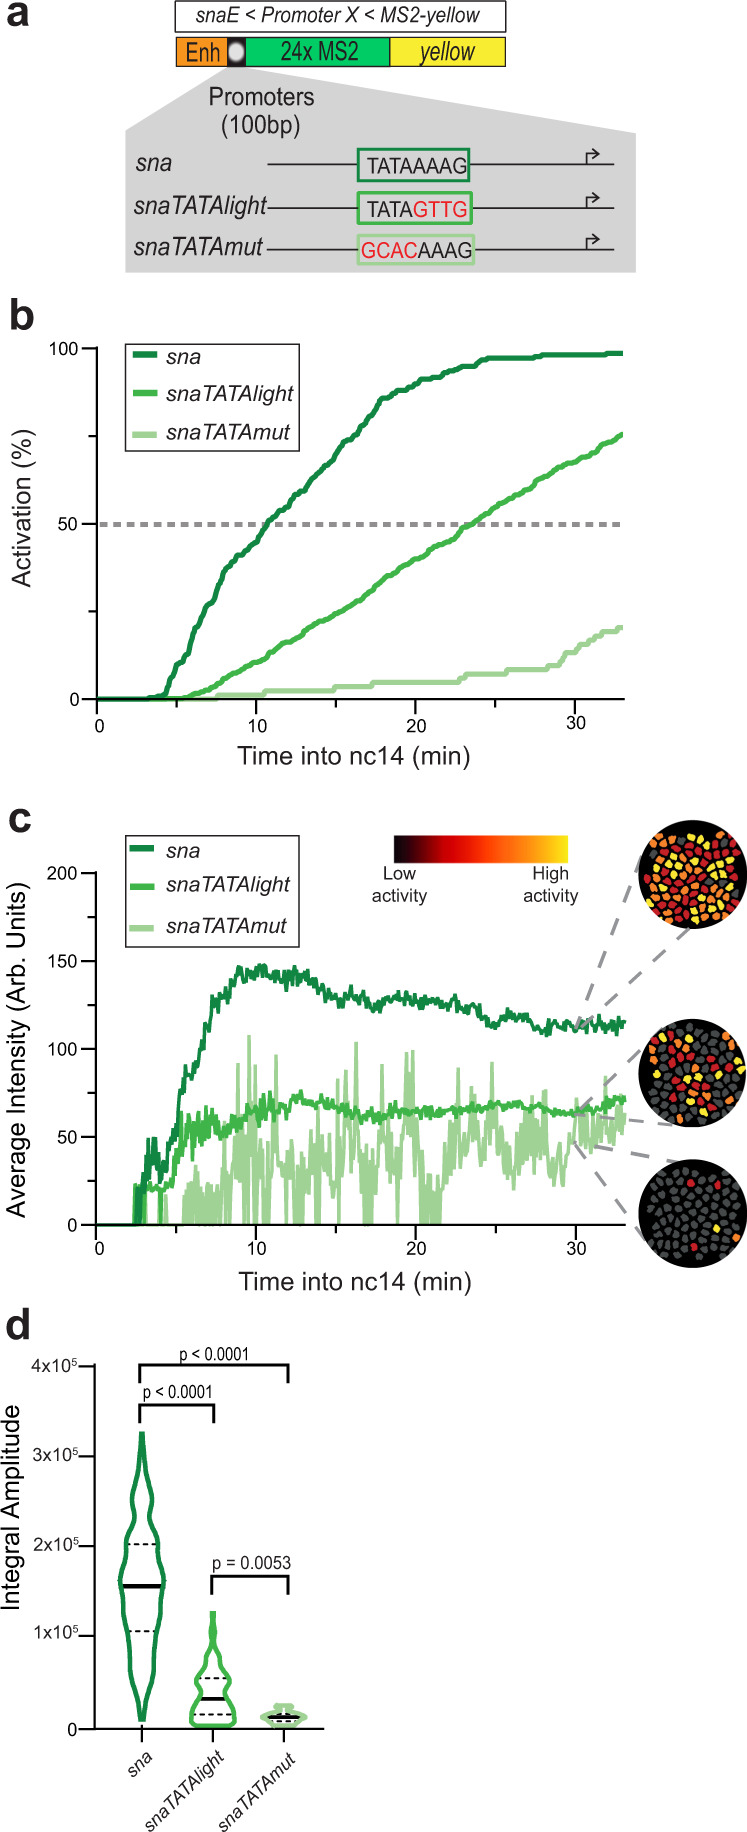
a TATA box mutations of the sna promoter. The snaTATAlight mutation corresponds to the sequence of the non-canonical TATA box from the kr promoter. b Cumulative active nuclei percentage within the mesodermal domain for sna (dark green), snaTATAlight (green), and snaTATAmut (light green). c Average instantaneous fluorescence of transcriptional foci of active nuclei during the first 30 min of nc14 for sna (dark green), snaTATAlight (green), and snaTATAmut (light green). Time zero is from anaphase during nc13-nc14 mitosis. False-colored panels on the right are colored according to instantaneous fluorescence intensity, with inactive nuclei shown in gray and highly active nuclei in yellow. d Distribution of individual trace integral amplitudes from first 30 min of nc14. The solid line represents median and dashed lines the first and third quartiles, using a one-tailed Kruskal–Wallis test for significance with multiple comparison adjustments. Statistics: snaE < sna, 216 nuclei, 3 movies; snaE < snaTATAlight, 353 nuclei, 6 movies; snaE < snaTATAmut, 21 nuclei, 3 movies. See Supplementary Movies 1–3.