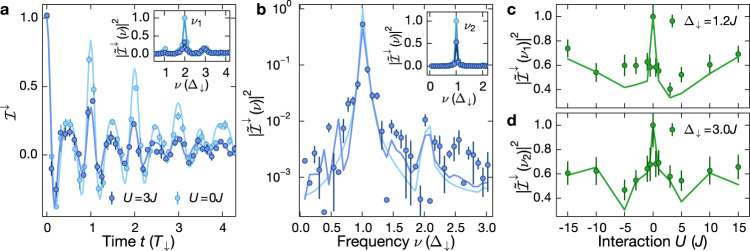
Fig. 2. Short-time interacting Bloch oscillations.
a Imbalance for U = 0J (spin-polarized gas, light blue) and U = 3J (spin-resolved measurement, dark blue) with J/h = 0.88(2) kHz and Δ↓ = 1.22(1)J. Inset: Power spectral density (PSD) of the time traces shown in the main panel, normalized to the maximum of the non-interacting spectrum; ν1 = 2Δ↓/h indicates the dominant frequency component. b PSD for U = 3J (spin-resolved measurement, dark blue), normalized to the maximum of the non-interacting spectrum; J/h = 0.54(1) kHz and Δ↓ = 2.96(3)J. The data were obtained from time-traces as in (a). Inset: PSD as in the main panel and for U = 0J (spin-polarized gas, light blue). ν2 = Δ↓/h indicates the dominant frequency. c, d Interaction scan of the peak power spectral density evaluated by summing the PSD in a window of ±3 data points around the dominant frequency νj, j = {1, 2} at c Δ↓ = 1.22(1)J and d Δ↓ = 2.96(3)J obtained from traces as in (a). Each data point in (a, b) consists of four independent measurements and the error bars denote the standard error of the mean (SEM). Solid lines in all panels are numerical simulations using TEBD (“Methods”).

