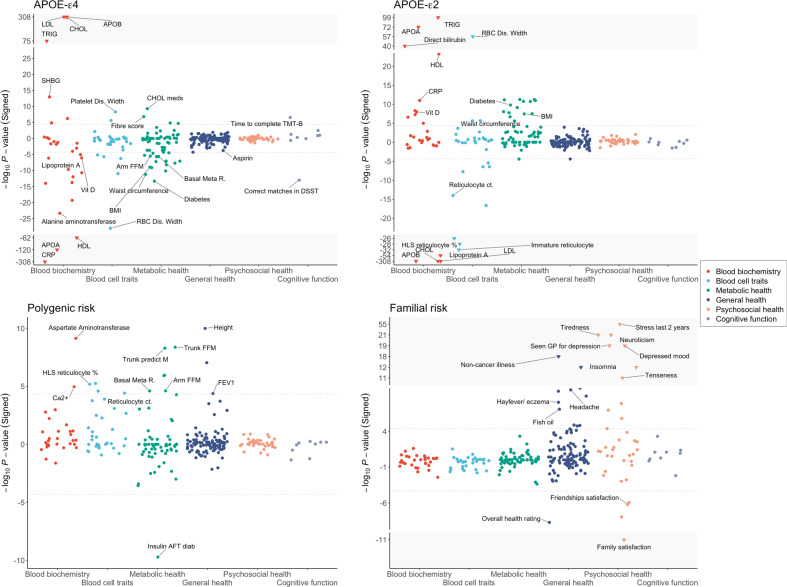
Fig. 1. Associations between APOE-ε4, APOE-ε2, polygenic risk (AD PRS) and AD familial risk and 273 traits in the UK Biobank.
These association analyses between the genetic risk factors and UK Biobank traits (described in the “Methods” section) were controlled for age, age2, sex, age*sex interaction term, socioeconomic status based on Townsend deprivation index, genotyping batch, assessment centre, and the first 12 principal components of ancestry, self-reported CVD, statin use, parental CVD and lifestyle score in the models. The grey dotted lines correspond to the P-value significance threshold (P < 4.5 × 10⁻⁵; see Methods). The Y-axis has been truncated to show all associated traits to improve visualization, with extreme results shown in the grey area with inverted triangles.

