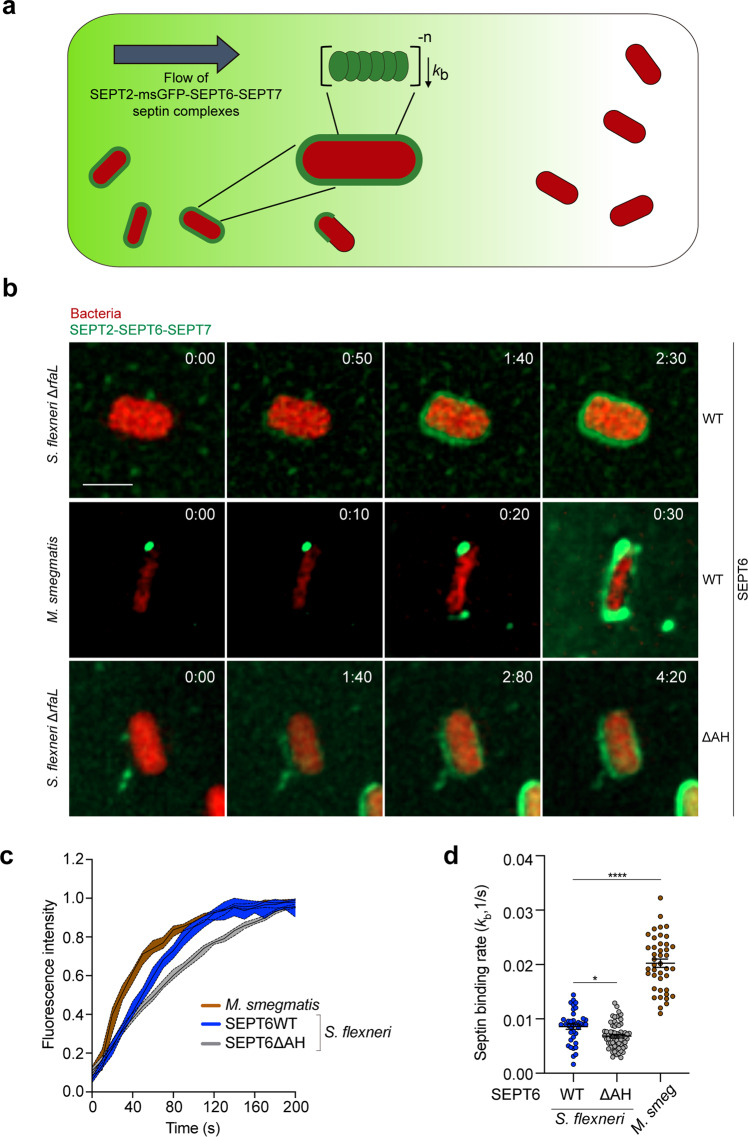
Fig. 5. The kinetics of septin binding depends on bacterial species and the amphipathic helix domain of SEPT6.
a Scheme showing the protocol followed to calculate the binding rates of SEPT2–msGFP-SEPT6–SEPT7 septin complexes (green) to bacteria using microfluidics and fluorescence microscopy. b Representative time-lapse fluorescence microscopy showing the entrapment of S. flexneri ΔrfaL producing cytosolic mCherry (msGFP-SEPT6WT-complexes, top panel; msGFP-SEPT6ΔAH-complexes, bottom panel) and M. smegmatis (msGFP-SEPT6WT-complexes, middle panel) in septin cages (green) in vitro. Time is showed as min:s (top right corner). This experiment was performed 2 independent times. Scale bar, 2 μm. c Mean msGFP–SEPT6 intensity per cell over time showing binding of septin complexes to S. flexneri ΔrfaL mCherry (blue line, msGFP-SEPT6WT; gray line, msGFP-SEPT6ΔAH) and M. smegmatis DsRed (brown line). Mean intensity values are normalized by maximum intensity observed in each cell for visualization purposes. Data represent the median ± 95% confident interval of n = 38 (S. flexneri ΔrfaL + msGFP-SEPT6WT), n = 60 (S. flexneri ΔrfaL + msGFP-SEPT6ΔAH), and n = 42 (M. smegmatis) cells distributed in 2 independent experiments. d Extracted binding rates (kb) of septin complexes to S. flexneri ΔrfaL mCherry and M. smegmatis DsRed in full septin cages in vitro. Data represent the mean ± SEM of n = 38 (S. flexneri ΔrfaL + msGFP-SEPT6WT), n = 60 (S. flexneri ΔrfaL + msGFP-SEPT6ΔAH), and n = 42 (M. smegmatis + msGFP-SEPT6WT) cells distributed in 2 independent experiments. *p = 0.0338, ****p < 0.0001 by one-way ANOVA and Dunnett’s post-test.

