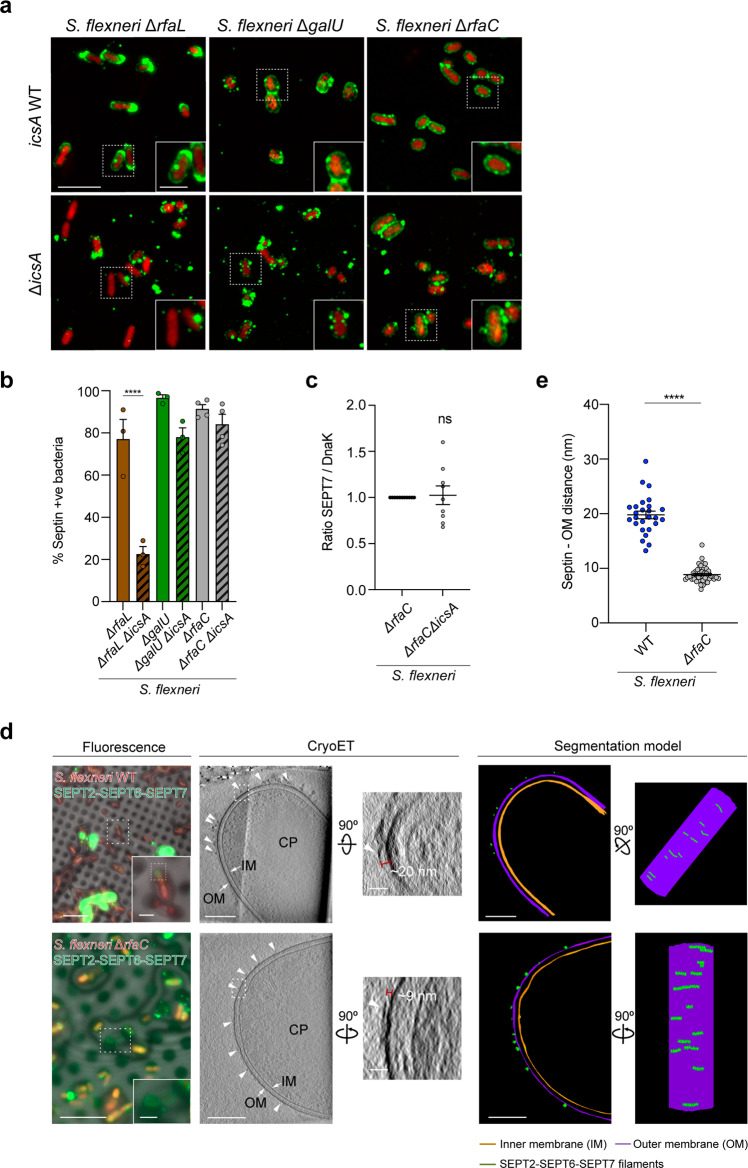
Fig. 6. IcsA disrupts lipopolysaccharide and promotes septin recognition of S. flexneri.
a Airyscan confocal images comparing septin binding in the presence (top) or absence (bottom) of IcsA to S. flexneri ΔrfaC, ΔrfaL, and ΔgalU. Scale bar, 5 μm. b Percentage of bacteria recruiting septins in vitro. Quantifications represent mean ± SEM from n = 1022 (ΔrfaC), n = 1072 (ΔrfaCΔicsA), n = 594 (ΔrfaL), n = 605 (ΔrfaLΔicsA), n = 653 (ΔgalU) and n = 761 (ΔgalUΔicsA) S. flexneri cells distributed in 3 independent experiments. ****p < 0.0001 by one-way ANOVA and Tukey’s post-test. c Bacterial sedimentation assays of samples from panel (a). Data represent mean ± SEM from 4 independent blots. ns, p = 0.665 by two-tailed Mann–Whitney’s test. d Representative correlative cryo-light microscopy and cryo-ET images of S. flexneri WT (top, accession No. #EMD-12571) or ΔrfaC (bottom, accession No. #EMD-12579) showing bound septins in vitro (arrowheads and green segmentation). Images shown correspond to a slice of 10.8-nm thickness (S. flexneri WT) and a slice of 11.0-nm thickness (S. flexneri ΔrfaC). CP, cytoplasm; OM, outer membrane; IM, inner membrane. This experiment was performed 2 independent times. Scale bars, fluorescence microscopy, 10 μm (inset, 2 μm), cryoET, 200 nm (inset, 50 nm). e Measured distance between septin filaments and the S. flexneri outer membrane. Data correspond to mean ± SEM from n = 26 (S. flexneri WT) and n = 46 (S. flexneri ΔrfaC) filaments from 3 independent tomograms. ****p < 0.0001 by two-tailed Student’s t-test.

