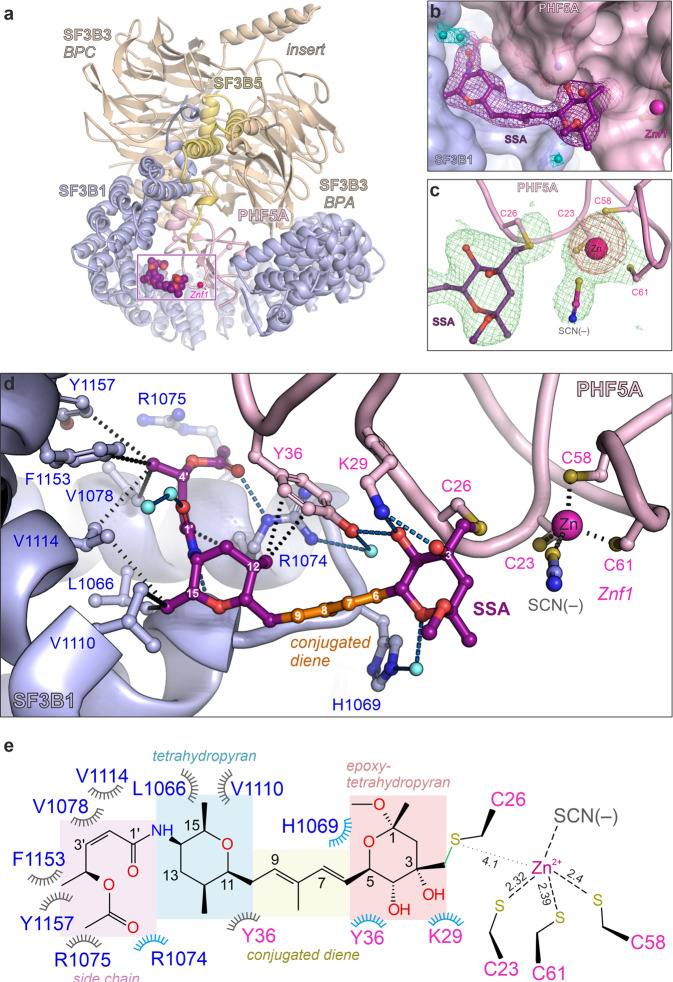
Fig. 2. Crystal structure of SF3B in complex with SSA.
a Structure overview of the SF3BΔBPB core in complex with SSA. b Electron density of the SSA within the crystal structure of the SF3B core. The 2mFo-DFc map is contoured at ~1.5 σ, and is displayed around the ligand and several water molecules (colored in purple and cyan, respectively). c Electron density (mFo-DFc, 3 σ) of the Znf1 motif of PHF5A and the covalently bound SSA ligand contoured around the final model. An anomalous difference map is depicted around the zinc ion and is colored red. d Crystal structure shows that SSA is engaged in multiple contacts with residues from the SF3B1-PHF5A binding tunnel. Distances between SSA and residues involved in hydrophobic contacts are shown as black dashes, whereas polar contacts are depicted as blue dashes. e Schematic depiction of the SSA interaction with residues from the hinged pocket, as observed in the crystal structure. Polar contacts are depicted in blue, whereas the hydrophobic interactions are colored gray. SSA’s functional groups are indicated as boxes.

